ICGOO在线商城 > 集成电路(IC) > 线性 - 音頻放大器 > TPA2026D2YZHT
- 型号: TPA2026D2YZHT
- 制造商: Texas Instruments
- 库位|库存: xxxx|xxxx
- 要求:
| 数量阶梯 | 香港交货 | 国内含税 |
| +xxxx | $xxxx | ¥xxxx |
查看当月历史价格
查看今年历史价格
TPA2026D2YZHT产品简介:
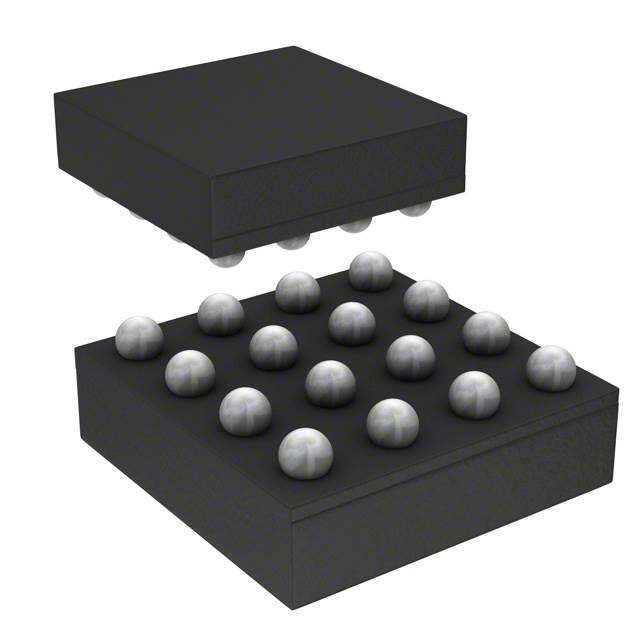
ICGOO电子元器件商城为您提供TPA2026D2YZHT由Texas Instruments设计生产,在icgoo商城现货销售,并且可以通过原厂、代理商等渠道进行代购。 TPA2026D2YZHT价格参考¥7.22-¥7.41。Texas InstrumentsTPA2026D2YZHT封装/规格:线性 - 音頻放大器, Amplifier IC 2-Channel (Stereo) Class D 16-DSBGA (2.24x2.16)。您可以下载TPA2026D2YZHT参考资料、Datasheet数据手册功能说明书,资料中有TPA2026D2YZHT 详细功能的应用电路图电压和使用方法及教程。
| 参数 | 数值 |
| 产品目录 | 集成电路 (IC)半导体 |
| 描述 | IC AMP AUDIO CLASS D 16DSBGA音频放大器 3.2W/Ch Stereo Smart Gain Class-D Aud Amp |
| 产品分类 | |
| 品牌 | Texas Instruments |
| 产品手册 | http://www.ti.com/lit/gpn/tpa2026d2 |
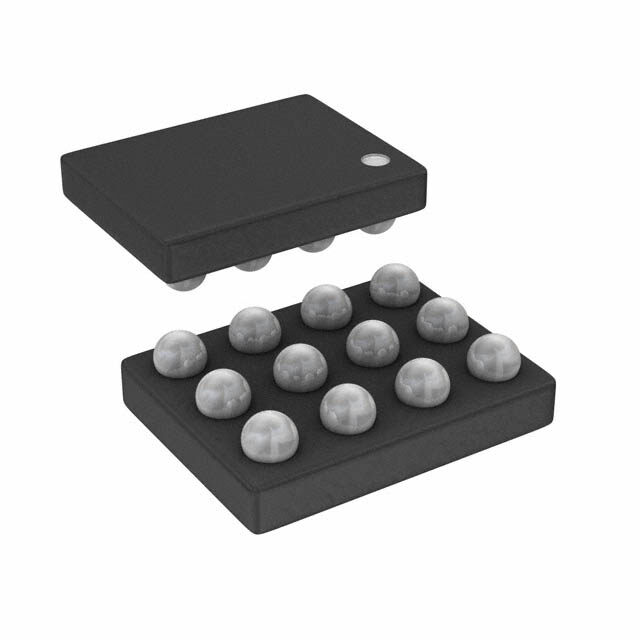
| 产品图片 |
|
| rohs | 符合RoHS无铅 / 符合限制有害物质指令(RoHS)规范要求 |
| 产品系列 | 音频 IC,音频放大器,Texas Instruments TPA2026D2YZHTSmartGain™ |
| 数据手册 | |
| 产品型号 | TPA2026D2YZHT |
| Pd-功率耗散 | 10 mW |
| THD+噪声 | 10 % |
| 不同负载时的最大输出功率x通道数 | 3.2W x 2 @ 4 欧姆 |
| 产品 | Audio Amplifiers |
| 产品种类 | 音频放大器 |
| 供应商器件封装 | 16-DSBGA(2x2) |
| 共模抑制比—最小值 | - 70 dB |
| 其它名称 | 296-27454-1 |
| 包装 | 剪切带 (CT) |
| 商标 | Texas Instruments |
| 安装类型 | 表面贴装 |
| 安装风格 | SMD/SMT |
| 封装 | Reel |
| 封装/外壳 | 16-UFBGA,DSBGA |
| 封装/箱体 | DSBGA-16 |
| 工作温度 | -40°C ~ 85°C (TA) |
| 工作电源电压 | 2.5 V to 5.5 V |
| 工厂包装数量 | 250 |
| 最大功率耗散 | 10 mW |
| 最大工作温度 | + 85 C |
| 最小工作温度 | - 40 C |
| 标准包装 | 1 |
| 特性 | 差分输入,I²C,短路和热保护,关机,音量控制 |
| 电压-电源 | 2.5 V ~ 5.5 V |
| 电源电压-最大 | 5.5 V |
| 电源电压-最小 | 2.5 V |
| 电源电流 | 3.5 mA, 3.7 mA, 4.5 mA |
| 类 | Class-D |
| 类型 | Differential |
| 系列 | TPA2026D2 |
| 输入信号类型 | Differential |
| 输出功率 | 3.2 W |
| 输出类型 | 2 通道(立体声) |
| 通道数量 | 2 Channel |




- 商务部:美国ITC正式对集成电路等产品启动337调查
- 曝三星4nm工艺存在良率问题 高通将骁龙8 Gen1或转产台积电
- 太阳诱电将投资9.5亿元在常州建新厂生产MLCC 预计2023年完工
- 英特尔发布欧洲新工厂建设计划 深化IDM 2.0 战略
- 台积电先进制程称霸业界 有大客户加持明年业绩稳了
- 达到5530亿美元!SIA预计今年全球半导体销售额将创下新高
- 英特尔拟将自动驾驶子公司Mobileye上市 估值或超500亿美元
- 三星加码芯片和SET,合并消费电子和移动部门,撤换高东真等 CEO
- 三星电子宣布重大人事变动 还合并消费电子和移动部门
- 海关总署:前11个月进口集成电路产品价值2.52万亿元 增长14.8%



PDF Datasheet 数据手册内容提取
Product Sample & Technical Tools & Support & Folder Buy Documents Software Community TPA2026D2 SLOS649B–MARCH2010–REVISEDMAY2016 TPA2026D2 3.2-W/Ch Stereo Class-D Audio Amplifier With Fast Gain Ramp SmartGain™ Automatic Gain Control and Dynamic Range Compression 1 Features 3 Description • FastAGCStart-UpTime:5ms TheTPA2026D2deviceisastereo,filter-freeClass-D 1 audio power amplifier with volume control, dynamic • PinoutCompatibleWithTPA2016D2 range compression (DRC), and automatic gain • Filter-FreeClass-DArchitecture control (AGC). It is available in a 2.2 mm × 2.2 mm • 3.2W/ChInto4 Ω at5V(10%THD+N) DSBGApackage. • 750mW/ChInto8Ω at3.6V(10%THD+N) The DRC and AGC function in the TPA2026D2 is • PowerSupplyRange:2.5Vto5.5V programmable through a digital I2C interface. The DRC and AGC function can be configured to • FlexibleOperationWithorWithoutI2C automatically prevent distortion of the audio signal • ProgrammableDRCandAGCParameters and enhance quiet passages that are normally not • DigitalI2CVolumeControl heard. The DRC and AGC can also be configured to protect the speaker from damage at high power • SelectableGainfrom0dBto30dBin1-dBSteps levelsandcompressthedynamicrangeofmusictofit • SelectableAttack,Release,andHoldTimes within the dynamic range of the speaker. The gain • 4SelectableCompressionRatios can be selected from 0 dB to +30 dB in 1-dB steps. • LowSupplyCurrent:3.5mA The TPA2026D2 is capable of driving 3.2 W/Ch at 5 Vintoan4-Ωloador750mW/Chat3.6Vintoan8-Ω • LowShutdownCurrent:0.2 μA load. The device features independent software • HighPSRR:80dB shutdowncontrolsforeachchannelandalsoprovides • AGCEnableorDisableFunction thermal and short-circuit protection. The TPA2026D2 has faster AGC gain ramp during start-up than • LimiterEnableorDisableFunction TPA2016D2. • Short-CircuitandThermalProtection In addition to these features, a fast start-up time and • Space-SavingPackage small package size make the TPA2026D2 an ideal – 2.2mm ×2.2mmNano-Free™DSBGA(YZH) choice for cellular handsets, PDAs, and other portableapplications. 2 Applications DeviceInformation(1) • WirelessorCellularHandsetsandPDAs PARTNUMBER PACKAGE BODYSIZE(NOM) • PortableNavigationDevices TPA2026D2 DSBGA(16) 2.20mm×2.20mm • PortableDVDPlayers (1) For all available packages, see the orderable addendum at • NotebookPCs theendofthedatasheet. • PortableRadios • PortableGames SimplifiedApplicationDiagram • EducationalToys To Battery • USBSpeakers 10mF AVDD PVDDL PVDDR TPA2026D2 C 1mF IN INL– Analog OUTL+ Baseband INL+ or INR– Codec INR+ OUTL– OUTR+ 2 IC Clock Digital 2 SCL OUTR– Baseband IC Data SDA Master Shutdown SDZ AGND PGND Copyright © 2016,Texas Instruments Incorporated 1 An IMPORTANT NOTICE at the end of this data sheet addresses availability, warranty, changes, use in safety-critical applications, intellectualpropertymattersandotherimportantdisclaimers.PRODUCTIONDATA.
TPA2026D2 SLOS649B–MARCH2010–REVISEDMAY2016 www.ti.com Table of Contents 1 Features.................................................................. 1 9.4 DeviceFunctionalModes........................................22 2 Applications........................................................... 1 9.5 Programming..........................................................23 3 Description............................................................. 1 9.6 RegisterMaps.........................................................25 4 RevisionHistory..................................................... 2 10 ApplicationandImplementation........................ 30 10.1 ApplicationInformation..........................................30 5 DeviceComparisonTable..................................... 3 10.2 TypicalApplications..............................................30 6 PinConfigurationandFunctions......................... 3 11 PowerSupplyRecommendations..................... 33 7 Specifications......................................................... 4 11.1 PowerSupplyDecouplingCapacitors..................33 7.1 AbsoluteMaximumRatings .....................................4 12 Layout................................................................... 33 7.2 ESDRatings..............................................................4 12.1 LayoutGuidelines.................................................33 7.3 RecommendedOperatingConditions.......................4 12.2 LayoutExample....................................................35 7.4 ThermalInformation..................................................4 12.3 EfficiencyandThermalConsiderations................35 7.5 ElectricalCharacteristics...........................................5 7.6 I2CTimingRequirements..........................................5 13 DeviceandDocumentationSupport................. 36 7.7 DissipationRatings...................................................5 13.1 DeviceSupport......................................................36 7.8 OperatingCharacteristics..........................................6 13.2 CommunityResources..........................................36 7.9 TypicalCharacteristics..............................................7 13.3 Trademarks...........................................................36 13.4 ElectrostaticDischargeCaution............................36 8 ParameterMeasurementInformation................12 13.5 Glossary................................................................36 9 DetailedDescription............................................ 13 14 Mechanical,Packaging,andOrderable 9.1 Overview.................................................................13 Information........................................................... 36 9.2 FunctionalBlockDiagram.......................................13 14.1 YZHPackageDimensions....................................36 9.3 FeatureDescription.................................................13 4 Revision History NOTE:Pagenumbersforpreviousrevisionsmaydifferfrompagenumbersinthecurrentversion. ChangesfromRevisionA(January2011)toRevisionB Page • AddedESDRatingstable,FeatureDescriptionsection,DeviceFunctionalModes,ApplicationandImplementation section,PowerSupplyRecommendationssection,Layoutsection,DeviceandDocumentationSupportsection,and Mechanical,Packaging,andOrderableInformationsection.................................................................................................. 1 ChangesfromOriginal(March2010)toRevisionA Page • ChangedtheDefaultvaluesinTable5 ............................................................................................................................... 26 • ChangedtheDefaultvalueoftheICFunctionControlTable(I2CBIT0)From:0(disabled)To:1(enabled) ...................26 2 SubmitDocumentationFeedback Copyright©2010–2016,TexasInstrumentsIncorporated ProductFolderLinks:TPA2026D2
TPA2026D2 www.ti.com SLOS649B–MARCH2010–REVISEDMAY2016 5 Device Comparison Table DEVICE SPEAKERAMPTYPE SPECIALFEATURE OUTPUTPOWER(W) PSRR(dB) NUMBER TPA2012D2 ClassD — 2.1 71 TPA2016D2 ClassD AGC/DRC 2.8 80 TPA2026D2 ClassD AGC/DRC 3.2 80 6 Pin Configuration and Functions YZHPackage 16-PinDSBGA TopView 1 2 3 4 A INR– INR+ INL+ INL– B AVDD SCL SDA AGND C PVDDR SDZ PGND PVDDL D OUTR+ OUTR– OUTL– OUTL+ PinFunctions PIN TYPE DESCRIPTION NO. NAME A1 INR– I Rightchannelnegativeaudioinput A2 INR+ I Rightchannelpositiveaudioinput A3 INL+ I Leftchannelpositiveaudioinput A4 INL– I Leftchannelnegativeaudioinput B1 AVDD P Analogsupply(mustbethesameasPVDDRandPVDDL) B2 SCL I I2Cclockinterface B3 SDA I/O I2Cdatainterface B4 AGND P Analogground(allGNDpinsneedtobeconnected) C1 PVDDR P Rightchannelpowersupply(mustbethesameasAVDDandPVDDL) C2 SDZ I Shutdownterminal(activelow) C3 PGND P Powerground(allGNDpinsneedtobeconnected) C4 PVDDL P Leftchannelpowersupply(mustbethesameasAVDDandPVDDR) D1 OUTR+ O Rightchannelpositivedifferentialoutput D2 OUTR– O Rightchannelnegativedifferentialoutput D3 OUTL– O Leftchannelnegativedifferentialoutput D4 OUTL+ O Leftchannelpositivedifferentialoutput Copyright©2010–2016,TexasInstrumentsIncorporated SubmitDocumentationFeedback 3 ProductFolderLinks:TPA2026D2
TPA2026D2 SLOS649B–MARCH2010–REVISEDMAY2016 www.ti.com 7 Specifications 7.1 Absolute Maximum Ratings(1) overoperatingfree-airtemperaturerange(unlessotherwisenoted). MIN MAX UNIT V Supplyvoltage AVDD,PVDDR,PVDDL –0.3 6 V DD SDZ,INR+,INR–,INL+,INL– –0.3 V +0.3 DD Inputvoltage V SDA,SCL –0.3 6 Continuoustotalpowerdissipation SeeDissipationRatings R Minimumloadresistance 3.2 Ω L T Operatingfree-airtemperature –40 85 °C A T Operatingjunctiontemperature –40 150 °C J T Storagetemperature –65 150 °C stg (1) StressesbeyondthoselistedunderAbsoluteMaximumRatingsmaycausepermanentdamagetothedevice.Thesearestressratings only,whichdonotimplyfunctionaloperationofthedeviceattheseoranyotherconditionsbeyondthoseindicatedunderRecommended OperatingConditions.Exposuretoabsolute-maximum-ratedconditionsforextendedperiodsmayaffectdevicereliability. 7.2 ESD Ratings VALUE UNIT Human-bodymodel(HBM),perANSI/ESDA/JEDECJS-001(1) ±2000 V Electrostaticdischarge V (ESD) Charged-devicemodel(CDM),perJEDECspecificationJESD22-C101(2) ±500 (1) JEDECdocumentJEP155statesthat500-VHBMallowssafemanufacturingwithastandardESDcontrolprocess. (2) JEDECdocumentJEP157statesthat250-VCDMallowssafemanufacturingwithastandardESDcontrolprocess. 7.3 Recommended Operating Conditions MIN MAX UNIT V Supplyvoltage AVDD,PVDDR,PVDDL 2.5 5.5 V DD V High-levelinputvoltage SDZ,SDA,SCL 1.3 V IH V Low-levelinputvoltage SDZ,SDA,SCL 0.6 V IL T Operatingfree-airtemperature –40 +85 °C A 7.4 Thermal Information TPA2026D2 THERMALMETRIC(1) YZH(DSBGA) UNIT 16PINS R Junction-to-ambientthermalresistance 71 °C/W θJA R Junction-to-case(top)thermalresistance 0.4 °C/W θJC(top) R Junction-to-boardthermalresistance 14.4 °C/W θJB ψ Junction-to-topcharacterizationparameter 1.9 °C/W JT ψ Junction-to-boardcharacterizationparameter 13.6 °C/W JB R Junction-to-case(bottom)thermalresistance — °C/W θJC(bot) (1) Formoreinformationabouttraditionalandnewthermalmetrics,seetheSemiconductorandICPackageThermalMetricsapplication report,SPRA953. 4 SubmitDocumentationFeedback Copyright©2010–2016,TexasInstrumentsIncorporated ProductFolderLinks:TPA2026D2
TPA2026D2 www.ti.com SLOS649B–MARCH2010–REVISEDMAY2016 7.5 Electrical Characteristics atT =25°C,V =3.6V,SDZ=1.3V,andR =8Ω+33μH(unlessotherwisenoted). A DD L PARAMETER TESTCONDITIONS MIN TYP MAX UNIT V Supplyvoltagerange 2.5 3.6 5.5 V DD SDZ=0.35V,V =2.5V 0.1 1 DD I Shutdownquiescentcurrent SDZ=0.35V,V =3.6V 0.2 1 µA SDZ DD SDZ=0.35V,V =5.5V 0.3 1 DD SDZ=1.3V,V =2.5V 35 50 DD Softwareshutdownquiescent I SDZ=1.3V,V =3.6V 50 70 µA SWS current DD SDZ=1.3V,V =5.5V 75 110 DD V =2.5V 3.5 4.5 DD I Supplycurrent V =3.6V 3.7 4.7 mA DD DD V =5.5V 4.5 5.5 DD f Class-Dswitchingfrequency 275 300 325 kHz SW I High-levelinputcurrent V =5.5V,SDZ=5.8V 1 µA IH DD I Low-levelinputcurrent V =5.5V,SDZ=–0.3V –1 µA IL DD t Start-uptime 2.5V≤V ≤5.5Vnopop,C ≤1μF 5 ms START DD IN POR PoweronresetONthreshold 2 2.3 V POR Poweronresethysteresis 0.2 V R =8Ω,V =0.5VandV =V –0.8V, CMRR Inputcommon-moderejection L icm icm DD –70 dB differentialinputsshorted V =3.6V,A =6dB,R =8Ω,inputsAC V Outputoffsetvoltage DD V L 2 10 mV oo grounded Outputimpedanceinshutdown 2 kΩ Z SDZ=0.35V OUT mode Gainaccuracy Compressionandlimiterdisabled,Gain=0to30dB –0.5 0.5 dB PSRR Powersupplyrejectionratio V =2.5Vto4.7V –80 dB DD 7.6 I2C Timing Requirements ForI2CInterfaceSignalsOverRecommendedOperatingConditions(unlessotherwisenoted) MIN TYP MAX UNIT f Frequency,SCL Nowaitstates 400 kHz SCL t Pulseduration,SCLhigh 0.6 μs W(H) t Pulseduration,SCLlow 1.3 μs W(L) t Setuptime,SDAtoSCL 100 ns SU(1) t Holdtime,SCLtoSDA 10 ns h1 t Busfreetimebetweenstopandstartcondition 1.3 μs (buf) t Setuptime,SCLtostartcondition 0.6 μs SU2 t Holdtime,startconditiontoSCL 0.6 μs h2 t Setuptime,SCLtostopcondition 0.6 μs SU3 7.7 Dissipation Ratings PACKAGE T ≤25°C DERATINGFACTOR T =70°C T =85°C A A A 16-ballWCSP(1) 1.25W 10mW/°C 0.8W 0.65W (1) Dissipationsratingsarefora2-side,2-planePCB. Copyright©2010–2016,TexasInstrumentsIncorporated SubmitDocumentationFeedback 5 ProductFolderLinks:TPA2026D2
TPA2026D2 SLOS649B–MARCH2010–REVISEDMAY2016 www.ti.com 7.8 Operating Characteristics atT =25°C,V =3.6V,SDZ=1.3V,R =8Ω+33μH,andA =6dB(unlessotherwisenoted). A DD L V MIN TYP MAX UNIT k Power-supplyripplerejectionratio V =3.6VdcwithACof200mV at217Hz –68 dB SVR DD PP f =1kHz,P =550mW,V =3.6V 0.1% aud_in O DD f =1kHz,P =1W,V =5V 0.1% aud_in O DD THD+N Totalharmonicdistortion+noise f =1kHz,P =630mW,V =3.6V 1% aud_in O DD f =1kHz,P =1.4W,V =5V 1% aud_in O DD Nfo Outputintegratednoise Av=6dB 44 μV nF Nfo Outputintegratednoise Av=6dBfloor,A-weighted 33 μV A FR Frequencyresponse Av=6dB 20 20000 Hz THD+N=10%,V =5V,R =8Ω 1.72 W DD L THD+N=10%,V =3.6V,R =8Ω 750 mW DD L Po Maximumoutputpower max THD+N=1%,V =5V,R =8Ω 1.4 W DD L THD+N=1%,V =3.6V,R =8Ω 630 mW DD L THD+N=1%,V =3.6V,R =8Ω,P =0.63W 90% DD L O η Efficiency THD+N=1%,V =5V,R =8Ω,P =1.4W 90% DD L O tw(H) tw(L) SCL t th1 su1 SDA Figure1. SCLandSDATiming SCL t t h2 (buf) t t su2 su3 SDA Start Condition Stop Condition Figure2. StartandStopConditionsTiming 6 SubmitDocumentationFeedback Copyright©2010–2016,TexasInstrumentsIncorporated ProductFolderLinks:TPA2026D2
TPA2026D2 www.ti.com SLOS649B–MARCH2010–REVISEDMAY2016 7.9 Typical Characteristics withC =1μF,C =1µF.AllTHD+Ngraphsaretakenwithoutputsoutofphase(unlessotherwisenoted).Alldata (DECOUPLE) I istakenonleftchannel. Table1.TableofGraphs FIGURE Quiescentsupplycurrent vsSupplyvoltage Figure3 Supplycurrent vsSupplyvoltageinshutdown Figure4 Outputlevel vsInputlevel Figure5 Outputlevel vsInputlevel Figure6 Outputlevel vsInputlevel Figure7 Outputlevel vsInputlevel Figure8 Outputlevel vsInputlevel Figure9 Supplyripplerejectionratio vsFrequency,8Ω Figure10 Totalharmonicdistortion+noise vsFrequencyV =2.5V,4Ω Figure11 SUPPLY Totalharmonicdistortion+noise vsFrequencyV =2.5V,8Ω Figure12 SUPPLY Totalharmonicdistortion+noise vsFrequencyV =3.6V,4Ω Figure13 SUPPLY Totalharmonicdistortion+noise vsFrequencyV =3.6V,8Ω Figure14 SUPPLY Totalharmonicdistortion+noise vsFrequencyV =5V,4Ω Figure15 SUPPLY Totalharmonicdistortion+noise vsFrequencyV =5V,8Ω Figure16 SUPPLY Totalharmonicdistortion+noise vsOutputpower,4Ω Figure17 Totalharmonicdistortion+noise vsOutputpower,8Ω Figure18 Efficiency vsOutputpower(perchannel),4Ω Figure19 Efficiency vsOutputpower(perchannel),8Ω Figure20 Totalpowerdissipation vsTotaloutputpower,4Ω Figure21 Totalpowerdissipation vsTotaloutputpower,8Ω Figure22 Totalsupplycurrent vsTotaloutputpower,4Ω Figure23 Totalsupplycurrent vsTotaloutputpower,8Ω Figure24 Outputpower vsSupplyvoltage,4Ω Figure25 Outputpower vsSupplyvoltage,8Ω Figure26 TPA2026D2 vsTPA2016D2Start-upgainramp Figure27 TPA2026D2 vsTPA2016D2Shutdowngainramp Figure28 Shutdowntime Figure29 Start-uptime Figure30 10 100 A m − nt 8 A 80 SDZ = VDD, SWS = 1 Curre mnt − ply 6 urre 60 p C nt Su 4 pply 40 e u c S es − ui D Q 2 D 20 SDZ = 0 V − I D D I 0 0 2.5 3.5 4.5 5.5 2.5 3.5 4.5 5.5 VDD − Supply Voltage − V G001 VDD − Supply Voltage − V G002 Figure3.QuiescentSupplyCurrentvsSupplyVoltage Figure4.SupplyCurrentVsSupplyVoltageinShutdown Copyright©2010–2016,TexasInstrumentsIncorporated SubmitDocumentationFeedback 7 ProductFolderLinks:TPA2026D2
TPA2026D2 SLOS649B–MARCH2010–REVISEDMAY2016 www.ti.com 20 20 Limiter Level = 9 dBV 10 10 RL = 8 W + 33 m H VSupply = 5 V Fixed Gain (2:1) V 0 V 0 Compression Ratio = 2:1 B B d d Max Gain = 30 dB el − −10 el − −10 v Limiter Level = −6.5 v e e ut L −20 LLiimmiitteerr LLeevveell == −−42..55 ut L −20 FFiixxeedd GGaaiinn == −−912 Outp −30 RL = 8 W + 33 m H LLLiiimmmiiittteeerrr LLLeeevvveeelll === −13..055.5 Outp −30 FFFiiixxxeeeddd GGGaaaiiinnn === −−063 VSupply = 5 V Limiter Level = 5.5 Fixed Gain = 3 −40 Fixed Gain = Max Gain = 30 dB Limiter Level = 7.5 −40 Fixed Gain = 6 Compression Ratio = 1:1 Limiter Level = 9 Fixed Gain = 9 −50 −50 Fixed Gain = 12 −40 −30 −20 −10 0 10 −70 −50 −30 −10 10 Input Level − dBV Input Level − dBV G003 G004 Figure5.OutputLevelvsInputlevelWithLimiterEnabled Figure6.OutputLevelvsInputlevelWith2:1Compression 20 20 Limiter Level = 9 dBV Limiter Level = 9 dBV 10 RL = 8 W + 33 m H 10 RL = 8 W + 33 m H VSupply = 5 V VSupply = 5 V Compression Ratio = 4:1 Compression Ratio = 8:1 V 0 Max Gain = 30 dB V 0 Max Gain = 30 dB B B d d el − −10 el − −10 v v e e ut L −20 Fixed Gain = −15 ut L −20 Outp −30 FFiixxeedd GGaaiinn == −−912 Outp −30 Fixed Gain = −12 Fixed Gain = −6 Fixed Gain = −27 Fixed Gain = −9 Fixed Gain = −27 Fixed Gain = −3 Fixed Gain = −24 Fixed Gain = −6 −40 Fixed Gain = −24 Fixed Gain = 0 −40 Fixed Gain = −21 Fixed Gain = −3 Fixed Gain = −21 Fixed Gain = 3 Fixed Gain = −18 Fixed Gain = 0 Fixed Gain = −18 Fixed Gain = 6 Fixed Gain = −15 Fixed Gain = 3 −50 −50 −70 −50 −30 −10 10 −70 −50 −30 −10 10 Input Level − dBV Input Level − dBV G005 G006 Figure7.OutputLevelvsInputlevelWith4:1Compression Figure8.OutputLevelvsInputlevelWith8:1Compression 20 0 10 LRVFiiSLmx ue=iptd ep8 rlGy WL a=e i +n5v e 3=Vl3 =0 m 9dH BdBV atio − dB −20 GRLeLaf it=n C 8=h Wa6n d+nB e3l3 m H VVVSSSuuupppppplllyyy === 235...560 VVV V 0 Max Gain = 30 dB R dB on Output Level − −−−321000 ply Ripple Rejecti −−6400 Compression Ratio = 1:1 up −−5400 CCCooommmppprrreeessssssiiiooonnn RRRaaatttiiiooo === 248:::111 K − SSVR −80 −70 −50 −30 −10 10 −100 20 100 1k 10k 20k Input Level − dBV G007 f − Frequency − Hz Figure9.OutputLevelvsInputlevel Figure10.SupplyRippleRejectionRatiovsFrequency,8Ω 8 SubmitDocumentationFeedback Copyright©2010–2016,TexasInstrumentsIncorporated ProductFolderLinks:TPA2026D2
TPA2026D2 www.ti.com SLOS649B–MARCH2010–REVISEDMAY2016 % 10 % 10 Noise − GRVSLau i=pnp 4l=y W=6 2d+.B 53 3V m H PPPOOO === 213520 50m mmWWW Noise − GRVSLau i=pnp 8l=y W=6 2d+.B 53 3V m H PPPOOO === 212520 50m mmWWW n + 1 n + 1 o o orti orti Dist Dist nic 0.1 nic 0.1 o o m m ar ar H H al al ot 0.01 ot 0.01 T T − − N N + + D D H H T 0.001 T 0.001 20 100 1k 10k 20k 20 100 1k 10k 20k f − Frequency − Hz f − Frequency − Hz Figure11.TotalHarmonicDistortion+NoisevsFrequency Figure12.TotalHarmonicDistortion+NoisevsFrequency V =2.5V,4Ω V =2.5V,8Ω SUPPLY SUPPLY % 10 % 10 Noise − GRVSLau i=pnp 4l=y W=6 3d+.B 63 3V m H PPPOOO === 527050 00m mmWWW Noise − GRVSLau i=pnp 8l=y W=6 3d+.B 63 3V m H PPPOOO === 525050 00m mmWWW n + 1 n + 1 o o orti orti Dist Dist nic 0.1 nic 0.1 o o m m ar ar H H al al ot 0.01 ot 0.01 T T − − N N + + D D H H T 0.001 T 0.001 20 100 1k 10k 20k 20 100 1k 10k 20k f − Frequency − Hz f − Frequency − Hz Figure13.TotalHarmonicDistortion+NoisevsFrequency Figure14.TotalHarmonicDistortion+NoiseVsFrequency V =3.6V,4Ω V =3.6V,8Ω SUPPLY SUPPLY % 10 % 10 Noise − GRVSLau i=pnp 4l=y W=6 5d+.B 03 3V m H PPPOOO === 15100.7005 mm WWW Noise − GRVSLau i=pnp 8l=y W=6 5d+.B 03 3V m H PPPOOO === 15100 W00 mmWW n + 1 n + 1 o o orti orti Dist Dist nic 0.1 nic 0.1 o o m m ar ar H H al al ot 0.01 ot 0.01 T T − − N N + + D D H H T 0.001 T 0.001 20 100 1k 10k 20k 20 100 1k 10k 20k f − Frequency − Hz f − Frequency − Hz Figure15.TotalHarmonicDistortion+NoisevsFrequency Figure16.TotalHarmonicDistortion+NoisevsFrequency V =5V,4Ω V =5V,8Ω SUPPLY SUPPLY Copyright©2010–2016,TexasInstrumentsIncorporated SubmitDocumentationFeedback 9 ProductFolderLinks:TPA2026D2
TPA2026D2 SLOS649B–MARCH2010–REVISEDMAY2016 www.ti.com % 100 % 100 Noise − GRf =La i=1n k4=H W6z d+B 33 m H VVVSSSuuupppppplllyyy === 235...560 VVV Noise − GRf =La i=1n k8=H W6z d+B 33 m H VVVSSSuuupppppplllyyy === 235...560 VVV n + 10 n + 10 o o orti orti Dist Dist nic 1 nic 1 o o m m ar ar H H al al ot 0.1 ot 0.1 T T − − N N + + D D H H T 0.01 T 0.01 10m 100m 1 4 10m 100m 1 3 PO − Output Power (Per Channel) − W PO − Output Power (Per Channel) − W Figure17.TotalHarmonicDistortion+NoisevsPower, Figure18.TotalHarmonicDistortion+NoisevsPower, 4Ω 8Ω 100 100 80 80 % % − 60 − 60 ncy ncy e e Effici 40 GRLa i=n 4= W6 d+B 33 m H Effici 40 GRLa i=n 8= W6 d+B 33 m H f = 1 kHz f = 1 kHz 20 20 VSupply = 2.5 V VSupply = 2.5 V VSupply = 3.6 V VSupply = 3.6 V VSupply = 5.0 V VSupply = 5.0 V 0 0 0.0 0.5 1.0 1.5 2.0 2.5 3.0 3.5 0.0 0.5 1.0 1.5 2.0 PO − Output Power (Per Channel) − W PO − Output Power (Per Channel) − W Figure19.EfficiencyvsOutputPower(PerChannel),4Ω Figure20.EfficiencyvsOutputPower(PerChannel),8Ω 1.0 0.4 Gain = 6 dB Gain = 6 dB 0.9 RL = 4 W + 33 m H RL = 8 W + 33 m H W f = 1 kHz W f = 1 kHz − 0.8 − n n 0.3 atio 0.7 atio p p Dissi 0.6 Dissi er 0.5 er 0.2 w w Po 0.4 Po al al ot 0.3 ot T T − − 0.1 P D 0.2 VSupply = 2.5 V P D VSupply = 2.5 V 0.1 VSupply = 3.6 V VSupply = 3.6 V VSupply = 5.0 V VSupply = 5.0 V 0.0 0.0 0 1 2 3 4 5 6 7 0 1 2 3 4 PO − Total Output Power − W PO − Total Output Power − W Figure21.TotalPowerDissipationvsTotalOutputPower, Figure22.TotalPowerDissipationvsTotalOutputPower, 4Ω 8Ω 10 SubmitDocumentationFeedback Copyright©2010–2016,TexasInstrumentsIncorporated ProductFolderLinks:TPA2026D2
TPA2026D2 www.ti.com SLOS649B–MARCH2010–REVISEDMAY2016 1.6 1.0 Gain = 6 dB Gain = 6 dB 1.4 RL = 4 W + 33 m H RL = 8 W + 33 m H f = 1 kHz f = 1 kHz A A 0.8 − 1.2 − nt nt e e Curr 1.0 Curr 0.6 pply 0.8 pply u u S S al 0.6 al 0.4 ot ot T T I − DD 0.4 VSupply = 2.5 V I − DD 0.2 VSupply = 2.5 V 0.2 VSupply = 3.6V VSupply = 3.6V VSupply = 5.0 V VSupply = 5.0 V 0.0 0.0 0 1 2 3 4 5 6 7 0 1 2 3 4 PO − Total Output Power − W PO − Total Output Power − W Figure23.TotalSupplyCurrentvsTotalOutputPower,4Ω Figure24.TotalSupplyCurrentvsTotalOutputPower,8Ω 4.0 2.5 f = 1 kHz f = 1 kHz 3.5 Gain = 6 dB Gain = 6 dB RWLC =S 4P W + 33 m H 2.0 RWLC =S 8P W + 33 m H W 3.0 W − − wer 2.5 wer 1.5 o o P P ut 2.0 ut p p Out 1.5 Out 1.0 − − O O P 1.0 P 0.5 0.5 THD = 1% THD = 1% THD = 10% THD = 10% 0.0 0.0 2.5 3.0 3.5 4.0 4.5 5.0 5.5 2.5 3.0 3.5 4.0 4.5 5.0 5.5 Vsupply − Supply Voltage − V Vsupply − Supply Voltage − V Figure25.OutputPowervsSupplyVoltage,4Ω Figure26.OutputPowervsSupplyVoltage,8Ω Figure27.TPA2026D2vsTPA2016D2Start-UpGainRamp Figure28.TPA2026D2vsTPA2016D2ShutdownGainRamp 1 1 Output Output 0.75 SWS 0.75 Disable 0.5 0.5 SWS Enable Voltage - V -00..22550 Voltage - V -00..22550 -0.5 -0.5 -0.75 -0.75 -1 -1 0 200m 400m 600m 800m 1m 1.2m 1.4m 1.6m 1.8m 2m 0 1m 2m 3m 4m 5m 6m 7m 8m 9m 10m t - Time - s t - Time - s Figure29.ShutdownTime Figure30.Start-UpTime Copyright©2010–2016,TexasInstrumentsIncorporated SubmitDocumentationFeedback 11 ProductFolderLinks:TPA2026D2
TPA2026D2 SLOS649B–MARCH2010–REVISEDMAY2016 www.ti.com 8 Parameter Measurement Information All parameters are measured according to the conditions described in Specifications. Figure 31 shows the setup usedforthetypicalcharacteristicsofthetestdevice. C TPA2026D2 I + IN+ OUT+ + 30 kHz Measurement Measurement C Load Low-Pass Output I Input Filter – IN– OUT– – VDD GND + 1mF V DD – (1) Allmeasurementsweretakenwitha1-μFC (unlessotherwisenoted). I (2) A33-μHinductorwasplacedinserieswiththeloadresistortoemulateasmallspeakerforefficiencymeasurements. (3) The30-kHzlow-passfilterisrequired,eveniftheanalyzerhasaninternallow-passfilter.AnRClow-passfilter(1kΩ 4.7nF)isusedoneachoutputforthedatasheetgraphs. Figure31. TestSetupforGraphs 12 SubmitDocumentationFeedback Copyright©2010–2016,TexasInstrumentsIncorporated ProductFolderLinks:TPA2026D2
TPA2026D2 www.ti.com SLOS649B–MARCH2010–REVISEDMAY2016 9 Detailed Description 9.1 Overview The TPA2026D2 is a stereo Class-D audio power amplifier capable of driving 750 mW/Ch into 8-Ω load at 3.6 V and 3.2 W/Ch into 4-Ω load at 5 V. The device features independent software shutdown controls for each channel and also provides thermal and short-circuit protection. In addition to these features, a fast start-up time and small package size make the TPA2026D2 an ideal choice for cellular handsets, PDAs, and other portable applications. 9.2 Functional Block Diagram 2 SDA I CInterface SCL 2 Biasand AVDD ICshutdown ICInterface References SDZ &Control PVDDL CIN OUTL+ INL- Differential Volume Class-D Power InputLeft INL+ Control Modulator Stage OUTL- 1uF AGC AGC Reference PVDDR CIN OUTR+ INR- Differential Volume Class-D Power InputRight INR+ Control Modulator Stage OUTR- 1uF AGND PGND Copyright © 2016,Texas Instruments Incorporated 9.3 Feature Description 9.3.1 AutomaticGainControl The Automatic Gain Control (AGC) feature provides continuous automatic gain adjustment to the amplifier through an internal PGA. This feature enhances the perceived audio loudness and at the same time prevents speakerdamagefromoccurring(Limiterfunction). The AGC function attempts to maintain the audio signal gain as selected by the user through the Fixed Gain, LimiterLevel,andCompressionRatiovariables.OtheradvancedfeaturesincludedareMaximumGainandNoise GateThreshold.Table2describesthefunctionofeachvariableintheAGCfunction. Table2.TPA2026D2AGCVariableDescriptions VARIABLE DESCRIPTION MaximumGain Thegainatthelowerendofthecompressionregion. ThenormalgainofthedevicewhentheAGCisinactive. FixedGain ThefixedgainisalsotheinitialgainwhenthedevicecomesoutofshutdownmodeorwhentheAGCis disabled. LimiterLevel Thevaluethatsetsthemaximumallowedoutputamplitude. Copyright©2010–2016,TexasInstrumentsIncorporated SubmitDocumentationFeedback 13 ProductFolderLinks:TPA2026D2
TPA2026D2 SLOS649B–MARCH2010–REVISEDMAY2016 www.ti.com Feature Description (continued) Table2.TPA2026D2AGCVariableDescriptions(continued) VARIABLE DESCRIPTION CompressionRatio Therelationbetweeninputandoutputvoltage. NoiseGateThreshold Belowthisvalue,theAGCholdsthegaintopreventbreathingeffects. AttackTime Theminimumtimebetweentwogaindecrements. ReleaseTime Theminimumtimebetweentwogainincrements. HoldTime Thetimeittakesfortheveryfirstgainincrementaftertheinputsignalamplitudedecreases. TheAGCworksbydetectingtheaudioinputenvelope.Thegainchangesdependingontheamplitude,thelimiter level, the compression ratio, and the attack and release time. The gain changes constantly as the audio signal increases and/or decreases to create the compression effect. The gain step size for the AGC is 0.5 dB. If the audiosignalhasnear-constantamplitude,thegaindoesnotchange.Figure32showshowtheAGCworks. Limiter threshold L A N G SI T U P N I Limiter threshold B C D E A GAIN Limiter threshold L A N G SI T U P T U Release Time O Hold Time Limiter threshold Attack Time A. Gaindecreaseswithnodelay;attacktimeisreset.Releasetimeandholdtimearereset. B. Signalamplitudeabovelimiterlevel,butgaincannotchangebecauseattacktimeisnotover. C. Attack time ends; gain is allowed to decrease from this point forward by one step. Gain decreases because the amplituderemainsabovelimiterthreshold.Alltimesarereset D. Gainincreasesafterreleasetimefinishesandsignalamplituderemainsbelowdesiredlevel.Alltimesareresetafter thegainincrease. E. Gain increases after release time is finished again because signal amplitude remains below desired level. All times areresetafterthegainincrease. Figure32. InputandOutputAudioSignalvsTime 14 SubmitDocumentationFeedback Copyright©2010–2016,TexasInstrumentsIncorporated ProductFolderLinks:TPA2026D2
TPA2026D2 www.ti.com SLOS649B–MARCH2010–REVISEDMAY2016 Because the number of gain steps is limited the compression region is limited as well. Figure 33 shows how the gainchangesversustheinputsignalamplitudeinthecompressionregion. B d n - ai G V - dBV IN Figure33. InputSignalVoltagevsGain Thus the AGC performs a mapping of the input signal versus the output signal amplitude. This mapping can be modifiedaccordingtothevariablesfromTable2. The following graphs and explanations show the effect of each variable to the AGC independently and which considerationsshouldbetakenwhenchoosingvalues. 9.3.1.1 FixedGain ThefixedgaindeterminestheinitialgainoftheAGC.Setthegainusingthefollowingvariables: • SetthefixedgaintobeequaltothegainwhentheAGCisdisabled. • SetthefixedgaintomaximizeSNR. • Setthefixedgainsuchthatitwillnotoverdrivethespeaker. Figure34showshowthefixedgaininfluencestheinputsignalamplitudeversustheoutputsignalamplitudestate diagram. The dotted 1:1 line is displayed for reference. The 1:1 line means that for a 1-dB increase in the input signal,theoutputincreasesby1dB. dB Increasing = 6 Fixed Gain n ai G Fixed n = 3 dB Decreasing Gai Fixed Gain V ed dB Fix - T U 1 O 1: V V - dBV IN Figure34. OutputSignalvsInputSignalStateDiagramShowingDifferentFixedGainConfigurations If the Compression function is enabled, the Fixed Gain is adjustable from –28 dB to 30 dB. If the Compression functionisdisabled,theFixedgainisadjustablefrom0dBto30dB. Copyright©2010–2016,TexasInstrumentsIncorporated SubmitDocumentationFeedback 15 ProductFolderLinks:TPA2026D2
TPA2026D2 SLOS649B–MARCH2010–REVISEDMAY2016 www.ti.com 9.3.1.2 LimiterLevel The Limiter level sets the maximum amplitude allowed at the output of the amplifier. The limiter should be set withthefollowingconstraintsinmind: • Beloworatthemaximumpowerratingofthespeaker • Belowtheminimumsupplyvoltageinordertoavoidclipping Figure 35 shows how the limiter level influences the input signal amplitude versus the output signal amplitude statediagram. Increasing Limiter Level=630mW Limiter Level Limiter Level=500mW V Limiter Level=400mW Decreasing B d Limiter - Level T U O V V - dBV IN Figure35. OutputSignalvsInputSignalStateDiagramShowingDifferentLimiterLevelConfigurations The limiter level and the fixed gain influence each other. If the fixed gain is set high, the AGC has a large limiter range.Thefixedgainissetlow,theAGChasashortlimiterrange.Figure36 illustratesthetwoexamples: Large Fixed Gain Small V B Fixed d Gain - UT 1:1 O V V - dBV IN Figure36. OutputSignalvsInputSignalStateDiagramShowingSameLimiterLevelConfigurationsWith DifferentFixedGainConfigurations 9.3.1.3 CompressionRatio The compression ratio sets the relation between input and output signal outside the limiter level region. The compression ratio compresses the dynamic range of the audio. For example if the audio source has a dynamic range of 60 dB and compression ratio of 2:1 is selected, then the output has a dynamic range of 30 dB. Most small form factor speakers have small dynamic range. Compression ratio allows audio with large dynamic range tofitintoaspeakerwithsmalldynamicrange. The compression ratio also increases the loudness of the audio without increasing the peak voltage. The higher thecompressionratio,theloudertheperceivedaudio. Forexample: • A compression ratio of 4:1 is selected (meaning that a 4-dB change in the input signal results in a 1-dB signal changeattheoutput) • Afixedgainof0dBisselectedandthemaximumaudiolevelisat0dBV. 16 SubmitDocumentationFeedback Copyright©2010–2016,TexasInstrumentsIncorporated ProductFolderLinks:TPA2026D2
TPA2026D2 www.ti.com SLOS649B–MARCH2010–REVISEDMAY2016 When the input signal decreases to –32 dBV, the amplifier increases the gain to 24 dB in order to achieve an outputof–8dBV.Theoutputsignalamplitudeequationis: Inputsignalinitialamplitude-|Currentinputsignalamplitude| Outputsignalamplitude= Compressionratio (1) Inthisexample: 0dBV - |-32dBV| -8dBV= 4 (2) Thegainchangeequationis: æ 1 ö Gainchange= ç1 - ÷ ×Inputsignalchange è Compressionratioø (3) æ 1ö 24dB= ç1 - ÷ ×32 è 4ø (4) Considerthefollowingwhensettingthecompressionratio: • Dynamicrangeofthespeaker • Fixedgainlevel • LimiterLevel • AudioLoudnessvsOutputDynamicRange Figure37showsdifferentsettingsfordynamicrangeanddifferentfixedgainselectedbutnolimiterlevel. Rotation Point@ higher gain 8 :1 4 :1 Increasing 2 :1 Fixed Gain Rotation 1 1: Point@ lower gain V 8 :1 B Decreasing d - T 4 :1 U O V 2 :1 1 : 1 V - dBV IN Figure37. OutputSignalvsInputSignalStateDiagramShowingDifferentCompressionRatio ConfigurationsWithDifferentFixedGainConfigurations The rotation point is always at V = 10 dBV. The rotation point is not located at the intersection of the limiter IN region and the compression region. By changing the fixed gain the rotation point will move in the y-axis direction only,asshowninthepreviousgraph. Copyright©2010–2016,TexasInstrumentsIncorporated SubmitDocumentationFeedback 17 ProductFolderLinks:TPA2026D2
TPA2026D2 SLOS649B–MARCH2010–REVISEDMAY2016 www.ti.com 9.3.1.4 InteractionBetweenCompressionRatioandLimiterRange Thecompressionratiocanbelimitedbythelimiterrange. NOTE Thelimiterrangeisselectedbythelimiterlevelandthefixedgain. For a setting with large limiter range, the amount of gain steps in the AGC remaining to perform compression are limited.Figure38showstwoexamples,wherethefixedgainwaschanged. 1. Smalllimiterrangeyieldingalargecompressionregion(smallfixedgain). 2. Largelimiterrangeyieldingasmallcompressionregion(largefixedgain). LargeLimiter Rotation Small Range Point@ Compression highergain Region Rotation Point@ lowergain SmallLimiter V Range B d Large - T Compression U 1 O 1: Region V V -dBV IN Figure38. OutputSignalvsInputSignalStateDiagramShowingtheEffectsoftheLimiterRangetothe CompressionRegion 9.3.1.5 NoiseGateThreshold The noise gate threshold prevents the AGC from changing the gain when there is no audio at the input of the amplifier. The noise gate threshold stops gain changes until the input signal is above the noise gate threshold. Select the noise gate threshold to be above the noise but below the minimum audio at the input of the amplifier signal. A filter is needed between delta-sigma CODEC/DAC and TPA2026D2 for effectiveness of the noise gate function. The filter eliminates the out-of-band noise from delta-sigma modulation and keeps the CODEC/DAC outputnoiselowerthanthenoisegatethreshold. 18 SubmitDocumentationFeedback Copyright©2010–2016,TexasInstrumentsIncorporated ProductFolderLinks:TPA2026D2
TPA2026D2 www.ti.com SLOS649B–MARCH2010–REVISEDMAY2016 s m nput Signalplitude - Vr Noise Gate Threshold AuNdoio Im A time Gain does not change in this region B d n - ai G time Figure39. TimeDiagramShowingtheRelationshipBetweenInputSignalAmplitude,NoiseGate Threshold,andGainVersusTime 9.3.1.6 MaximumGain This variable limits the number of gain steps in the AGC. This feature is useful in order to accomplish a more advancedoutputsignalversusinputsignaltransfercharacteristic. Forexample,topreventthegainfromgoingaboveacertainvalue,reducethemaximumgain. However, this variable will affect the limiter range and the compression region. If the maximum gain is decreased,thelimiterrangeand/orcompressionregionisreduced.Figure40illustratestheeffects. Max Gain Max Gain =30dB =22dB V B d - T 1:1 U O V V - dBV IN Figure40. OutputSignalvsInputSignalStateDiagramShowingDifferentMaximumGains A particular application requiring maximum gain of 22 dB, for example. Thus, set the maximum gain at 22 dB. Theamplifiergainneverhasagainhigherthan22dB;however,thisreducesthelimiterrange. 9.3.1.7 Attack,Release,andHoldTime • Theattacktimeistheminimumtimebetweengaindecreases. • Thereleasetimeistheminimumtimebetweengainincreases. • The hold time is the minimum time between a gain decrease (attack) and a gain increase (release). The hold timecanbedeactivated.Holdtimeisonlyvalidifgreaterthanreleasetime. Copyright©2010–2016,TexasInstrumentsIncorporated SubmitDocumentationFeedback 19 ProductFolderLinks:TPA2026D2
TPA2026D2 SLOS649B–MARCH2010–REVISEDMAY2016 www.ti.com Successive gain decreases are never faster than the attack time. Successive gain increases are never faster thanthereleasetime. All time variables (attack, release, and hold) start counting after each gain change performed by the AGC. The AGC is allowed to decrease the gain (attack) only after the attack time finishes. The AGC is allowed to increase the gain (release) only after the release time finishes counting. However, if the preceding gain change was an attack (gain increase) and the hold time is enabled and longer than the release time, then the gain is only increasedaftertheholdtime. The hold time is only enabled after a gain decrease (attack). The hold time replaces the release time after a gain decrease (attack). If the gain needs to be increased further, then the release time is used. The release time is usedinsteadoftheholdtimeiftheholdtimeisdisabled. The attack time must be at least 100 times shorter than the release and hold time. The hold time must be the same or greater than the release time. It is important to select reasonable values for those variables in order to preventthegainfromchangingtoooftenortooslow. Figure41illustratestherelationshipbetweenthethreetimevariables. Input Signal Amplitue (Vrms) Gain dB Time end Attack time Time reset Release time Hold time Hold timer not used after first gain increase time Figure41. TimeDiagramShowingtheRelationBetweentheAttack,Release,andHoldTimevsInput SignalAmplitudeandGain Figure42showsastatediagramoftheinputsignalamplitudeversustheoutputsignalamplitudeandasummary ofhowthevariablesfromTable2describedintheprecedingpagesaffectthem. 20 SubmitDocumentationFeedback Copyright©2010–2016,TexasInstrumentsIncorporated ProductFolderLinks:TPA2026D2
TPA2026D2 www.ti.com SLOS649B–MARCH2010–REVISEDMAY2016 Fixed Gain Rotation Point 8:1 ¥:1 Limiter 1:1 4m:1pre2s:s1io n R e gio n Level C o 1 dBV 1: ckTime me - UT Atta aseTi VO old Rele h es Maximum r h Gain T e at G e s oi N V -dBV 10 dBV IN Figure42. OutputSignalvsInputSignalStateDiagram 9.3.2 OperationWithDACSandCODECS In using Class-D amplifiers with CODECs and DACs, sometimes there is an increase in the output noise floor from the audio amplifier. This occurs when output frequencies of the CODEC/DAC mix with the Class-D switching frequency and create sum or difference components in the audio band. The noise increase can be solved by placing an RC low-pass filter between the CODEC/DAC and audio amplifier. The filter reduces high frequenciesthatcausetheproblemandallowsproperperformance. If driving the TPA2016D2 input with 4th-order or higher ΔΣ DACs or CODECs, add an RC low-pass filter at each of the audio inputs (IN+ and IN–) of the TPA2016D2 to ensure best performance. The recommended resistor valueis100Ωandthecapacitorvalueof47nF. 9.3.3 Short-CircuitAuto-Recovery When a short-circuit event happens, the TPA2026D2 goes to low duty cycle mode and tries to reactivate itself every 110 µs. This auto-recovery continues until the short-circuit event stops. This feature can protect the device withoutaffectingthedevice'slong-termreliability.FAULTbit(register1,bit3)stillrequiresawritetoclear. 9.3.4 Filter-FreeOperationandFerriteBeadFilters A ferrite bead filter can often be used if the design is failing radiated emissions without an LC filter and the frequency-sensitive circuit is greater than 1 MHz. This filter functions well for circuits that just have to pass FCC and CE because FCC and CE only test radiated emissions greater than 30 MHz. When choosing a ferrite bead, chooseonewithhighimpedanceathighfrequencies,andlowimpedanceatlowfrequencies.Inaddition,selecta ferritebeadwithadequatecurrentratingtopreventdistortionoftheoutputsignal. Use an LC output filter if there are low frequency (< 1 MHz) EMI-sensitive circuits or there are long leads from amplifiertospeaker.Figure43showstypicalferritebeadandLCoutputfilters. Copyright©2010–2016,TexasInstrumentsIncorporated SubmitDocumentationFeedback 21 ProductFolderLinks:TPA2026D2
TPA2026D2 SLOS649B–MARCH2010–REVISEDMAY2016 www.ti.com Ferrite Chip Bead OUTP 1 nF Ferrite Chip Bead OUTN 1 nF Figure43. TypicalFerriteBeadFilter(ChipBeadExample:TDK:MPZ1608S221A) 9.4 Device Functional Modes 9.4.1 TPA2026D2AGCOperation TheTPA2026D2iscontrolledbytheI2Cinterface.Thecorrectstart-upsequenceis: 1. ApplythesupplyvoltagetotheAV andPV (L,R)pins. DD DD 2. ApplyavoltageaboveV totheSDZpin.TheTPA2026D2powersuptheI2Cinterfaceandthecontrollogic. IH By default, the device is in active mode (SWS = 0). After 5 ms the amplifier enables the class-D output stage andbecomefullyoperational. 9.4.1.1 AGCStart-UpCondition Theamplifiergainatstart-updependsonthefollowingconditions: 1. Start-up from hardware reset (EN from 0 to 1): The amplifier starts up immediately at default fixed gain. AGC startscontrollinggainoncetheinputaudiosignalexceedsnoisegatethreshold. 2. Start-up from software shutdown (SWS from 1 to 0): The amplifier starts up immediately at the latest fixed gainduringsoftwareshutdown,regardlesstheattackorreleasetime.Forexample: – Audioisplayingatfixedgain6dB – Devicesgoestosoftwareshutdown(SWS=1) – Setfixedgainfrom6dBto12dB – Removesoftwareshutdown(SWS=0) – Amplifierstartsupimmediatelyat12dB 3. DuringaudioplaybackwithAGCon,gainchangesaccordingtoattackorreleasetime.Forexample: – Audioisplayingatfixedgain6dBand1:1compressionratio – Setfixedgainfrom6dBto12dB,atreleasetime500ms/6dB – Amplifiertakes500mstorampfrom6dBto12dB 4. When SPKR_EN_R = 0, SPKR_EN_L = 0 and SWS = 0, the amplifier is set at fixed gain. The amplifier will startupatfixedgainwheneitherSPKR_EN_RandSPKR_EN_Ltransitionsfrom0to1. CAUTION Donotinterruptthestart-upsequenceafterchangingSDZfromV toV . IL IH Donotinterruptthestart-upsequenceafterchangingSWSfrom1to0. The default conditions of TPA2026D2 allows audio playback without I2C control. Refer to Table 5 for the entire defaultconditions. Thereareseveraloptionstodisabletheamplifier: • Write SPK_EN_R = 0 and SPK_EN_L = 0 to the register (0x01, 6 and 0x01, 7). This write disables each speakeramplifier,butleavesallothercircuitsoperating. 22 SubmitDocumentationFeedback Copyright©2010–2016,TexasInstrumentsIncorporated ProductFolderLinks:TPA2026D2
TPA2026D2 www.ti.com SLOS649B–MARCH2010–REVISEDMAY2016 Device Functional Modes (continued) • WriteSWS=1totheregister(0x01,5).Thisactiondisablesmostoftheamplifierfunctions. • Apply V to SDZ. This action shuts down all the circuits and has very low quiescent current consumption. IL Thisactionresetstheregisterstoitsdefaultvalues. CAUTION DonotinterrupttheshutdownsequenceafterchangingSDZfromV toV . IH IL DonotinterrupttheshutdownsequenceafterchangingSWSfrom0to1. 9.4.2 TPA2026D2AGCRecommendedSettings Table3.RecommendedAGCSettingsforDifferentTypesofAudioSource(V =3.6V) DD AUDIO COMPRESSION ATTACKTIME RELEASETIME HOLDTIME FIXEDGAIN LIMITERLEVEL SOURCE RATIO (ms/6dB) (ms/6dB) (ms) (dB) (dBV) PopMusic 4:1 1.28to3.84 986to1640 137 6 7.5 Classical 2:1 2.56 1150 137 6 8 Jazz 2:1 5.12to10.2 3288 — 6 8 Rap/HipHop 4:1 1.28to3.84 1640 — 6 7.5 Rock 2:1 3.84 4110 — 6 8 Voice/News 4:1 2.56 1640 — 6 8.5 9.5 Programming 9.5.1 GeneralI2COperation The I2C bus employs two signals, SDA (data) and SCL (clock), to communicate between integrated circuits in a system. The bus transfers data serially one bit at a time. The address and data 8-bit bytes are transferred most significant bit (MSB) first. In addition, each byte transferred on the bus is acknowledged by the receiving device with an acknowledge bit. Each transfer operation begins with the master device driving a start condition on the bus and ends with the master device driving a stop condition on the bus. The bus uses transitions on the data terminal (SDA) while the clock is at logic high to indicate start and stop conditions. A high-to-low transition on SDA indicates a start and a low-to-high transition indicates a stop. Normal data-bit transitions must occur within the low time of the clock period. Figure 44 shows a typical sequence. The master generates the 7-bit slave address and the read/write (R/W) bit to open communication with another device, and then waits for an acknowledge condition. The TPA2026D2 holds SDA low during the acknowledge clock period to indicate acknowledgment. When this acknowledgment occurs, the master transmits the next byte of the sequence. Each deviceisaddressedbyaunique7-bitslaveaddressplusR/Wbit(1byte).Allcompatibledevicessharethesame signalsthroughabidirectionalbususingawired-ANDconnection. An external pullup resistor must be used for the SDA and SCL signals to set the logic high level for the bus. Whenthebuslevelis5V,usepullupresistorsbetween1kΩ and2kΩ. 8- Bit Data for 8- Bit Data for Register (N) Register (N+1) Figure44. TypicalI2CSequence Copyright©2010–2016,TexasInstrumentsIncorporated SubmitDocumentationFeedback 23 ProductFolderLinks:TPA2026D2
TPA2026D2 SLOS649B–MARCH2010–REVISEDMAY2016 www.ti.com Programming (continued) Thereisnolimitonthenumberofbytesthatcanbetransmittedbetweenstartandstopconditions.Whenthelast word transfers, the master generates a stop condition to release the bus. A generic data transfer sequence is showninFigure44. 9.5.2 SingleandMultiple-ByteTransfers Theserialcontrolinterfacesupportsbothsingle-byteandmulti-byteread/writeoperationsforallregisters. During multiple-byte read operations, the TPA2026D2 responds with data, one byte at a time, starting at the registerassigned,aslongasthemasterdevicecontinuestorespondwithacknowledgments. The TPA2026D2 supports sequential I2C addressing. For write transactions, if a register is issued followed by data for that register and all the remaining registers that follow, a sequential I2C write transaction has occurred. For I2C sequential write transactions, the register issued then serves as the starting point, and the amount of datasubsequentlytransmitted,beforeastoporstartistransmitted,determinesthenumberofregisterswritten. 9.5.3 Single-ByteWrite As Figure 45 shows, a single-byte data write transfer begins with the master device transmitting a start condition followed by the I2C device address and the read/write bit. The read/write bit determines the direction of the data transfer. For a write data transfer, the read/write bit must be set to 0. After receiving the correct I2C device addressandtheread/writebit,theTPA2026D2respondswithanacknowledgebit.Next,themastertransmitsthe register byte corresponding to the TPA2026D2 internal memory address being accessed. After receiving the register byte, the TPA2026D2 again responds with an acknowledge bit. Next, the master device transmits the data byte to be written to the memory address being accessed. After receiving the register byte, the TPA2026D2 again responds with an acknowledge bit. Finally, the master device transmits a stop condition to complete the single-bytedatawritetransfer. Start Condition Acknowledge Acknowledge Acknowledge A6 A5 A4 A3 A2 A1 A0 R/W ACK A7 A6 A5 A4 A3 A2 A1 A0 ACK D7 D6 D5 D4 D3 D2 D1 D0 ACK I2C Device Address and Register Data Byte Stop Read/Write Bit Condition Figure45. Single-ByteWriteTransfer 9.5.4 Multiple-ByteWriteandIncrementalMultiple-ByteWrite A multiple-byte data write transfer is identical to a single-byte data write transfer except that multiple data bytes are transmitted by the master device to the TPA2026D2 as shown in Figure 46. After receiving each data byte, theTPA2026D2respondswithanacknowledgebit. Register Figure46. Multiple-ByteWriteTransfer 9.5.5 Single-ByteRead As Figure 47 shows, a single-byte data read transfer begins with the master device transmitting a start condition followed by the I2C device address and the read/write bit. For the data read transfer, both a write followed by a read are actually executed. Initially, a write is executed to transfer the address byte of the internal memory addresstoberead.Asaresult,theread/writebitissettoa0. 24 SubmitDocumentationFeedback Copyright©2010–2016,TexasInstrumentsIncorporated ProductFolderLinks:TPA2026D2
TPA2026D2 www.ti.com SLOS649B–MARCH2010–REVISEDMAY2016 Programming (continued) After receiving the TPA2026D2 address and the read/write bit, the TPA2026D2 responds with an acknowledge bit. The master then sends the internal memory address byte, after which the TPA2026D2 issues an acknowledge bit. The master device transmits another start condition followed by the TPA2026D2 address and the read/write bit again. This time the read/write bit is set to 1, indicating a read transfer. Next, the TPA2026D2 transmits the data byte from the memory address being read. After receiving the data byte, the master device transmitsanot-acknowledgefollowedbyastopconditiontocompletethesingle-bytedatareadtransfer. Repeat Start Start Condition Not Condition Acknowledge Acknowledge Acknowledge Acknowledge A6 A5 A1 A0 R/W ACK A7 A6 A5 A4 A0 ACK A6 A5 A1 A0 R/W ACK D7 D6 D1 D0 ACK I2C Device Address and Register I2C Device Address and Data Byte Stop Read/Write Bit Read/Write Bit Condition Figure47. Single-ByteReadTransfer 9.5.6 Multiple-ByteRead A multiple-byte data read transfer is identical to a single-byte data read transfer except that multiple data bytes are transmitted by the TPA2026D2 to the master device as shown in Figure 48. With the exception of the last databyte,themasterdevicerespondswithanacknowledgebitafterreceivingeachdatabyte. Repeat Start Condition Start Not Condition Acknowledge Acknowledge Acknowledge Acknowledge Acknowledge Acknowledge A6 A0 R/W ACK A7 A6 A5 A0 ACK A6 A0 R/WACK D7 D0 ACK D7 D0 ACK D7 D0 ACK I2C Device Address and Register I2C Device Address and First Data Byte Other Data Bytes Last Data Byte Stop Read/Write Bit Read/Write Bit Condition Figure48. Multiple-ByteReadTransfer 9.6 Register Maps Table4.TPA2026D2RegisterMap REGISTER BIT7 BIT6 BIT5 BIT4 BIT3 BIT2 BIT1 BIT0 1 SPK_EN_R SPL_EN_L SWS FAULT_R FAULT_L Thermal 1 NG_EN 2 0 0 ATK_time[5] ATK_time[4] ATK_time[3] ATK_time[2] ATK_time[1] ATK_time[0] 3 0 0 REL_time[5] REL_time[4] REL_time[3] REL_time[2] REL_time[1] REL_time[0] 4 0 0 Hold_time[5] Hold_time[4] Hold_tme[3] Hold_time[2] Hold_time[1] Hold_time[0] 5 0 0 FixedGain[5] FixedGain[4] FixedGain[3] FixedGain[2] FixedGain[1] FixedGain[0] Output Output Output NoiseGate NoiseGate OutputLimiter OutputLimiter OutputLimiter 6 Limiter LimiterLevel LimiterLevel Threshold[1] Threshold[2] Level[4] Level[1] Level[0] Disable [3] [2] Compression Compression 7 MaxGain[3] MaxGain[2] MaxGain[1] MaxGain[0] 0 0 Ratio[1] Ratio[0] Copyright©2010–2016,TexasInstrumentsIncorporated SubmitDocumentationFeedback 25 ProductFolderLinks:TPA2026D2
TPA2026D2 SLOS649B–MARCH2010–REVISEDMAY2016 www.ti.com ThedefaultregistermapvaluesaregiveninTable5. Table5.TPA2026D2DefaultRegisterValues REGISTER 0x01 0x02 0x03 0x04 0x05 0x06 0x07 Default C3h 05h 0Bh 00h 06h 3Ah C2h Any register above address 0x08 is reserved for testing and must not be written to because it may change the functionofthedevice.Ifread,thesebitsmayassumeanyvalue. Some of the default values can be reprogrammed through the I2C interface and written to the EEPROM. This function is useful to speed up the turnon time of the device and minimizes the number of I2C writes. If this is required,contactyourlocalTIrepresentative. The TPA2026D2 I2C address is 0xB0 (binary 10110000) for writing and 0xB1 (binary 10110001) for reading. If a different I2C address is required, contact your local TI representative. See General I2C Operation for more details. The following tables show the details of the registers, the default values, and the values that can be programmed throughtheI2Cinterface. 9.6.1 ICFunctionControl(Address:1) Table6.ICFunctionControl(Address:1) REGISTER I2CBIT LABEL DEFAULT DESCRIPTION ADDRESS 01(01 )–IC 7 SPK_EN_R 1(enabled) Enablesrightamplifier H FunctionControl 6 SPK_EN_L 1(enabled) Enablesleftamplifier 5 SWS 0(enabled) ShutdownICwhenbit=1 4 FAULT_R 0 Changestoa1whenthereisashortontherightchannel.Resetbywriting a0. 3 FAULT_L 0 Changestoa1whenthereisashortontheleftchannel.Resetbywritinga 0 2 Thermal 0 Changestoa1whendietemperatureisabove150°C 1 UNUSED 1 0 NG_EN 1(enabled) EnablesNoiseGatefunction SPK_EN_R: Enablebitfortheright-channelamplifier.Amplifierisactivewhenbitishigh.Thisfunctionis gatedbythermalandreturnsoncetheICisbelowthethresholdtemperature. SPK_EN_L: Enablebitfortheleft-channelamplifier.Amplifierisactivewhenbitishigh.Thisfunctionis gatedbythermalandreturnsoncetheICisbelowthethresholdtemperature SWS: Softwareshutdowncontrol.Thedeviceisinsoftwareshutdownwhenthebitis1(control,bias andoscillatorareinactive).Whenthebitis0thecontrol,biasandoscillatorareenabled. FAULT_L: Thisbitindicatesthatanover-currenteventhasoccurredontheleftchannelwitha1.Thisbit isclearedbywritinga0toit. FAULT_R: Thisbitindicatesthatanover-currenteventhasoccurredontherightchannelwitha1.Thisbit isclearedbywritinga0toit. Thermal: Thisbitindicatesathermalshutdownthatwasinitiatedbythehardwarewitha1.Thisbitis deglitchedandlatched,andcanbeclearedbywritinga0toit. NG_EN: EnablebitfortheNoiseGatefunction.Thisfunctionisenabledwhenthisbitishigh.This functioncanonlybeenabledwhentheCompressionratioisnot1:1. 26 SubmitDocumentationFeedback Copyright©2010–2016,TexasInstrumentsIncorporated ProductFolderLinks:TPA2026D2
TPA2026D2 www.ti.com SLOS649B–MARCH2010–REVISEDMAY2016 9.6.2 AGCAttackControl(Address:2) Table7.AGCAttackControl(Address:2) REGISTER I2CBIT LABEL DEFAULT DESCRIPTION ADDRESS 02(02H)– 7:6 Unused 00 AGCControl 5:0 ATK_time 000101 AGCAttacktime(gainrampdown) (1.28ms/6dB) PerStep Per6dB 90%Range 000001 0.1067ms 1.28ms 5.76ms 000010 0.2134ms 2.56ms 11.52ms 000011 0.3201ms 3.84ms 17.19ms 000100 0.4268ms 5.12ms 23.04ms (timeincreasesby0.1067mswitheverystep) 111111 6.722ms 80.66ms 362.99ms ATK_time ThesebitssettheattacktimefortheAGCfunction.Theattacktimeistheminimumtime betweengaindecreases. 9.6.3 AGCReleaseControl(Address:3) Table8.AGCReleaseControl(Address:3) REGISTER I2CBIT LABEL DEFAULT DESCRIPTION ADDRESS 03(03H)–AGC 7:6 Unused 00 Release 5:0 REL_time 001011 AGCReleasetime(gainrampdown) Control (0.9864sec/6dB) PerStep Per6dB 90%Range 000001 0.0137s 0.1644s 0.7398s 000010 0.0274s 0.3288s 1.4796s 000011 0.0411s 0.4932s 2.2194s 000100 0.0548s 0.6576s 2.9592s (timeincreasesby0.0137switheverystep) 111111 0.8631s 10.36s 46.6s REL_time ThesebitssetthereleasetimefortheAGCfunction.Thereleasetimeistheminimumtime betweengainincreases. 9.6.4 AGCHoldTimeControl(Address:4) Table9.AGCHoldTimeControl(Address:4) REGISTER I2CBIT LABEL DEFAULT DESCRIPTION ADDRESS 04(04H)– 7:6 Unused 00 AGCHold 5:0 Hold_time 000000(disabled) AGCHoldtime TimeControl PerStep 000000 HoldTimeDisable 000001 0.0137s 000010 0.0274s 000011 0.0411s 000100 0.0548s (timeincreasesby0.0137switheverystep) 111111 0.8631s Hold_time ThesebitssettheholdtimefortheAGCfunction.Theholdtimeistheminimumtimebetween againdecrease(attack)andagainincrease(release).Theholdtimecanbedeactivated. Copyright©2010–2016,TexasInstrumentsIncorporated SubmitDocumentationFeedback 27 ProductFolderLinks:TPA2026D2
TPA2026D2 SLOS649B–MARCH2010–REVISEDMAY2016 www.ti.com 9.6.5 AGCFixedGainControl(Address:5) Table10.AGCFixedGainControl(Address:5) REGISTER I2CBIT LABEL DEFAULT DESCRIPTION ADDRESS 05(05H)– 7:6 Unused 00 AGCFixed 5:0 FixedGain 000110(6dB) Setsthefixedgainoftheamplifier:two'scomplement GainControl Gain 100100 –28dB 100101 –27dB 100110 –26dB (gainincreasesby1dBwitheverystep) 111101 –3dB 111110 –2dB 111111 –1dB 000000 0dB 000001 1dB 000010 2dB 000011 3dB (gainincreasesby1dBwitheverystep) 011100 28dB 011101 29dB 011110 30dB FixedGain Thesebitsareusedtoselectthefixedgainoftheamplifier.Ifcompressionisenabled,fixed gainisadjustablefrom –28dBto30dB.Ifcompressionisdisabled,fixedgainisadjustable from0dBto30dB. 9.6.6 AGCControl(Address:6) Table11.AGCControl(Address:6) REGISTER I2CBIT LABEL DEFAULT DESCRIPTION ADDRESS 06(06H)– 7 OutputLimiter 0(enable) Disablestheoutputlimiterfunction.CanonlybedisabledwhentheAGCcompression AGCControl Disable ratiois1:1(off) 6:5 NoiseGate 01(4mVrms) Selectthethresholdofthenoisegate Threshold Threshold 00 1mVrms 01 4mVrms 10 10mVrms 11 20mVrms 4:0 OutputLimiter 11010(6.5dBV) Selectstheoutputlimiterlevel Level OutputPower(Wrms) PeakOutputVoltage dBV (Vp) 00000 0.03 0.67 –6.5 00001 0.03 0.71 –6 00010 0.04 0.75 –5.5 (Limiterlevelincreasesby0.5dBwitheverystep) 11101 0.79 3.55 8 11110 0.88 3.76 8.5 11111 0.99 3.99 9 28 SubmitDocumentationFeedback Copyright©2010–2016,TexasInstrumentsIncorporated ProductFolderLinks:TPA2026D2
TPA2026D2 www.ti.com SLOS649B–MARCH2010–REVISEDMAY2016 OutputLimiter Thisbitdisablestheoutputlimiterfunctionwhensetto1.Canonlybedisabledwhen Disable theAGCcompressionratiois1:1 NoiseGateThreshold Thesebitssetthethresholdlevelofthenoisegate.NoiseGateThresholdisonly functionalwhenthecompressionratioisnot1:1 OutputLimiterLevel Thesebitsselecttheoutputlimiterlevel.OutputPowernumbersarefor8-Ω load. 9.6.7 AGCControl(Address:7) Table12.AGCControl(Address:7) REGISTER I2CBIT LABEL DEFAULT DESCRIPTION ADDRESS 07(07H)– 7:4 MaxGain 1100(30dB) SelectsthemaximumgaintheAGCcanachieve AGCControl Gain 0000 18dB 0001 19dB 0010 20dB (gainincreasesby1dBwitheverystep) 1100 30dB 3:2 Unused 00 1:0 Compression 10(4:1) SelectsthecompressionratiooftheAGC Ratio Ratio 00 1:1(off) 01 2:1 10 4:1 11 8:1 CompressionRatio Thesebitsselectthecompressionratio.OutputLimiterisenabledbydefaultwhenthe compressionratioisnot1:1. MaxGain Thesebitsselectthemaximumgainoftheamplifier.Inordertomaximizetheuseofthe AGC,settheMaxGainto30dB Copyright©2010–2016,TexasInstrumentsIncorporated SubmitDocumentationFeedback 29 ProductFolderLinks:TPA2026D2
TPA2026D2 SLOS649B–MARCH2010–REVISEDMAY2016 www.ti.com 10 Application and Implementation NOTE Information in the following applications sections is not part of the TI component specification, and TI does not warrant its accuracy or completeness. TI’s customers are responsible for determining suitability of components for their purposes. Customers should validateandtesttheirdesignimplementationtoconfirmsystemfunctionality. 10.1 Application Information These typical connection diagrams highlight the required external components and system level connections for proper operation of the device. Each of these configurations can be realized using the Evaluation Modules (EVMs) for the device. These flexible modules allow full evaluation of the device in the most common modes of operation.AnydesignvariationcanbesupportedbyTIthroughschematicandlayoutreviews.Visite2e.ti.com for designassistanceandjointheaudioamplifierdiscussionforumforadditionalinformation. 10.2 Typical Applications 10.2.1 TPA2026D2WithDifferentialInputSignals To Battery 10mF AVDD PVDDL PVDDR TPA2026D2 C 1mF IN INL– Analog OUTL+ Baseband INL+ or INR– Codec INR+ OUTL– OUTR+ 2 IC Clock Digital 2 SCL OUTR– Baseband IC Data SDA Master Shutdown SDZ AGND PGND Copyright © 2016,Texas Instruments Incorporated Figure49. TypicalApplicationSchematicWithDifferentialInputSignals 10.2.1.1 DesignRequirements Forthisdesignexample,usetheparameterslistedinTable13. Table13.DesignProcedure PARAMETER EXAMPLEVALUE Powersupply 5V High>1.3V Enableinputs Low<0.6V Speaker 8Ω 30 SubmitDocumentationFeedback Copyright©2010–2016,TexasInstrumentsIncorporated ProductFolderLinks:TPA2026D2
TPA2026D2 www.ti.com SLOS649B–MARCH2010–REVISEDMAY2016 10.2.1.2 DetailedDesignProcedure 10.2.1.2.1 SurfaceMountCapacitor Temperature and applied DC voltage influence the actual capacitance of high-K materials. Table 14 shows the relationship between the different types of high-K materials and their associated tolerances, temperature coefficients, and temperature ranges. Notice that a capacitor made with X5R material can lose up to 15% of its capacitancewithinitsworkingtemperaturerange. In an application, the working capacitance of components made with high-K materials is generally much lower than nominal capacitance. A worst-case result with a typical X5R material might be –10% tolerance, –15% temperature effect, and –45% DC voltage effect at 50% of the rated voltage. This particular case would result in aworkingcapacitanceof42%(0.9×0.85 ×0.55)ofthenominalvalue. Selecthigh-Kceramiccapacitorsaccordingtothefollowingrules: 1. UsecapacitorsmadeofmaterialswithtemperaturecoefficientsofX5R,X7R,orbetter. 2. Use capacitors with DC voltage ratings of at least twice the application voltage. Use minimum 10-V capacitorsfortheTPA2026D2. 3. Choose a capacitance value at least twice the nominal value calculated for the application. Multiply the nominalvaluebyafactorof2forsafety.Ifa10-μFcapacitorisrequired,use20 µF. The preceding rules and recommendations apply to capacitors used in connection with the TPA2026D2. The TPA2026D2cannotmeetitsperformancespecificationsiftherulesandrecommendationsarenotfollowed. Table14.TypicalToleranceandTemperatureCoefficientofCapacitancebyMaterial MATERIAL COG/NPO X7R X5R Typicaltolerance ±5% ±10% 80/–20% Temperature ±30ppm ±15% 22/–82% Temperaturerange –55to125°C –55to125°C –30to85°C 10.2.1.2.2 DecouplingCapacitor,C S The TPA2026D2 is a high-performance Class-D audio amplifier that requires adequate power supply decoupling to ensure the efficiency is high and total harmonic distortion (THD) is low. For higher frequency transients, spikes, or digital hash on the line, a good low equivalent-series-resistance (ESR) 1-μF ceramic capacitor (typically) placed as close as possible to the device PVDD (L, R) lead works best. Placing this decoupling capacitorclosetotheTPA2026D2isimportantfortheefficiencyoftheClass-Damplifier,becauseanyresistance orinductanceinthetracebetweenthedeviceandthecapacitorcancausealossinefficiency.Forfilteringlower- frequency noise signals, a 4.7 μF or greater capacitor placed near the audio power amplifier would also help, but itisnotrequiredinmostapplicationsbecauseofthehighPSRRofthisdevice. 10.2.1.2.3 InputCapacitors,C I The input capacitors and input resistors form a high-pass filter with the corner frequency, f , determined in C Equation5. 1 f = C (2p ´ R ´ C) I I (5) The value of the input capacitor is important to consider as it directly affects the bass (low frequency) performance of the circuit. Speakers in wireless phones cannot usually respond well to low frequencies, so the corner frequency can be set to block low frequencies in this application. Not using input capacitors can increase output offset. Equation 6 is used to solve for the input coupling capacitance. If the corner frequency is within the audio band, the capacitors must have a tolerance of ±10% or better, because any mismatch in capacitance causesanimpedancemismatchatthecornerfrequencyandbelow. 1 C = I (2p ´ R ´ f ) I C (6) Copyright©2010–2016,TexasInstrumentsIncorporated SubmitDocumentationFeedback 31 ProductFolderLinks:TPA2026D2
TPA2026D2 SLOS649B–MARCH2010–REVISEDMAY2016 www.ti.com 10.2.1.3 ApplicationCurves Forapplicationcurves,seethefigureslistedinTable15. Table15.TableofGraphs DESCRIPTION FIGURENUMBER OutputLevelvsInputLevel Figure6 THD+NvsFrequency Figure11 TotalPowerDissipationvsTotalOutputPower Figure22 OutputPowervsSupplyVoltage Figure26 10.2.2 TPA2026D2WithSingle-EndedInputSignal To power supply 10uF AVDD PVDDL PVDDR CI TPA2026D2 INL- OUTL+ Analog INL+ OUTL- Baseband or CODEC INR- INR+ OUTR+ I2C Clock OUTR- SCL Digital I2C Data SDA Baseband Master Shutdown SDZ AGND PGND Copyright © 2016, Texas Instruments Incorporated Figure50. TypicalApplicationSchematicWithSingle-EndedInputSignal 10.2.2.1 DesignRequirements Forthisdesignexample,usetheparameterslistedinTable13. 10.2.2.2 DetailedDesignProcedure ForthedesignprocedureseeDetailedDesignProcedure fromtheprevioussection 10.2.2.3 ApplicationCurves Forapplicationcurves,seethefigureslistedinTable15. 32 SubmitDocumentationFeedback Copyright©2010–2016,TexasInstrumentsIncorporated ProductFolderLinks:TPA2026D2
TPA2026D2 www.ti.com SLOS649B–MARCH2010–REVISEDMAY2016 11 Power Supply Recommendations The TPA2026D2 is designed to operate from an input voltage supply range between 2.5 V and 5.5 V. Therefore the output voltage range of the power supply should be within this range. The current capability of upper power mustnotexceedthemaximumcurrentlimitofthepowerswitch. 11.1 Power Supply Decoupling Capacitors The TPA2026D2 requires adequate power supply decoupling to ensure a high efficiency operation with low total harmonic distortion (THD). Place a low equivalent-series-resistance (ESR) ceramic capacitor, typically 0.1 µF, within 2 mm of the VDD/VCCOUT pin. This choice of capacitor and placement helps with higher frequency transients, spikes, or digital hash on the line. In addition to the 0.1-μF ceramic capacitor, is recommended to place a 2.2-µF to 10-µF capacitor on the VDD supply trace. This larger capacitor acts as a charge reservoir, providingenergyfasterthantheboardsupply,thushelpingtopreventanydroopinthesupplyvoltage. 12 Layout 12.1 Layout Guidelines 12.1.1 PadSize In making the pad size for the WCSP balls, TI recommends that the layout use non solder mask-defined (NSMD) land. With this method, the solder mask opening is made larger than the desired land area, and the opening size is defined by the copper pad width. Figure 51 and Table 16 show the appropriate diameters for a WCSP layout. TheTPA2026D2evaluationmodule(EVM)layoutisshowninLayoutExample. Figure51. LandPatternDimensions Copyright©2010–2016,TexasInstrumentsIncorporated SubmitDocumentationFeedback 33 ProductFolderLinks:TPA2026D2
TPA2026D2 SLOS649B–MARCH2010–REVISEDMAY2016 www.ti.com Layout Guidelines (continued) Table16.LandPatternDimensions(1) (2) (3) (4) SOLDERPAD COPPERPAD SOLDERMASK(5) COPPER STENCIL(6) (7)OPENING STENCIL DEFINITIONS OPENING THICKNESS THICKNESS Nonsoldermask 275μm 375μm 275μm×275μmSq.(rounded 1ozmax(32μm) 125μmthick defined(NSMD) (+0.0,–25μm) (+0.0,–25μm) corners) (1) CircuittracesfromNSMDdefinedPWBlandsshouldbe75μmto100μmwideintheexposedareainsidethesoldermaskopening. Widertracewidthsreducedevicestandoffandimpactreliability. (2) BestreliabilityresultsareachievedwhenthePWBlaminateglasstransitiontemperatureisabovetheoperatingtherangeofthe intendedapplication. (3) RecommendsolderpasteisType3orType4. (4) ForaPWBusingaNi/Ausurfacefinish,thegoldthicknessmustbeless0.5mmtoavoidareductioninthermalfatigueperformance. (5) Soldermaskthicknessmustbelessthan20μmontopofthecoppercircuitpattern (6) Bestsolderstencilperformanceisachievedusinglasercutstencilswithelectropolishing.Useofchemicallyetchedstencilsresultsin inferiorsolderpastevolumecontrol. (7) TraceroutingawayfromWCSPdevicemustbebalancedinXandYdirectionstoavoidunintentionalcomponentmovementdueto solderwettingforces. 12.1.2 ComponentLocation Place all external components very close to the TPA2026D2. Placing the decoupling capacitor, C , close to the S TPA2026D2 is important for the efficiency of the Class-D amplifier. Any resistance or inductance in the trace betweenthedeviceandthecapacitorcancausealossinefficiency. 12.1.3 TraceWidth Recommended trace width at the solder balls is 75 μm to 100 μm to prevent solder wicking onto wider PCB traces. For high current pins (PVDD (L, R), PGND, and audio output pins) of the TPA2026D2, use 100-μm trace widths at the solder balls and at least 500-μm PCB traces to ensure proper performance and output power for the device. For the remaining signals of the TPA2026D2, use 75-μm to 100-μm trace widths at the solder balls. Theaudioinputpins(INR± andINL±)mustrunside-by-sidetomaximizecommon-modenoisecancellation. 34 SubmitDocumentationFeedback Copyright©2010–2016,TexasInstrumentsIncorporated ProductFolderLinks:TPA2026D2
TPA2026D2 www.ti.com SLOS649B–MARCH2010–REVISEDMAY2016 12.2 Layout Example xxDecoxuplinxg capxacitoxr xxxxxxxxxxxxInpuxt capaxcitorxs x INR- INR+ INL+ INL- placed as close as placed as close as xxpossxible tox the xdevicxe xxxxxxxxxxxpoxssiblex to thxe dexvice x xxxxxxxxxxxxxxxxxxxxxx C C I I xxxxxxxxxxxxxxxxxxxxxx xxxxxxxxxxxxxxxxxxxxxx xx1x0µFxxxx1xµF xxxxxxxxxxxxxx xxxxxxxxxxxxxxxxxxxxxx xxxxxxxxxA1xxA2 xA3xA4xxxxxxxSCxL x xxxxxxxxxB1xxB2 xB3xB4xxxxxxxxx SDA xxxxxxxxxxxxxxxxxxxxxx C1 C2 C3 C4 xxSDxZ xxxxxxxxxxxxxxxxxxxxx xxxxxxxxxD1xxD2 xxD3xxD4xxxxxxxxx xxxxxxxxxxTPxA20x26Dx2 xxxxxxxxx 10µF 1µF xxxxxxxxxxxxxxxxxxxxxx xxxxxxxxxxxxxxxxxxxxxx xxxxxxxxxxxxxxxxxDxecouxpling xcapaxcitor x OUTR+ OUTR- OUTL-OUTL+ placed as close as xxxxxxxxxxxxxxxxxpoxssiblxe to txhe dexvicex xxxxxxxxxxxxxxxxxxxxxx Top Layer Ground Plane Top Layer Traces Pad to Top Layer Ground Plane Bottom Layer Traces Via to Ground Plane Via to Bottom Layer Via to Power Supply Plane Figure52. LayoutRecommendation 12.3 Efficiency and Thermal Considerations The maximum ambient temperature depends on the heat-sinking ability of the PCB system. The derating factor forthepackageisshowninthedissipationratingtable.Convertingthisto θ fortheDSBGApackage: JA 100°C/W (7) Given θ of 100°C/W, the maximum allowable junction temperature of 150°C, and the maximum internal JA dissipation of 0.4 W (0.2 W per channel) for 1.5 W per channel, 8-Ω load, 5-V supply, from Figure 15, the maximumambienttemperaturecanbecalculatedwiththefollowingequation. T Max=TMax-q P =150-100(0.4)=110°C A J JA DMAX (8) Equation 8 shows that the calculated maximum ambient temperature is 110°C at maximum power dissipation with a 5-V supply and 8-Ω a load. The TPA2026D2 is designed with thermal protection that turns the device off when the junction temperature surpasses 150°C to prevent damage to the IC. Also, using speakers more resistive than 8-Ω dramatically increases the thermal performance by reducing the output current and increasing theefficiencyoftheamplifier. Copyright©2010–2016,TexasInstrumentsIncorporated SubmitDocumentationFeedback 35 ProductFolderLinks:TPA2026D2
TPA2026D2 SLOS649B–MARCH2010–REVISEDMAY2016 www.ti.com 13 Device and Documentation Support 13.1 Device Support 13.1.1 Third-PartyProductsDisclaimer TI'S PUBLICATION OF INFORMATION REGARDING THIRD-PARTY PRODUCTS OR SERVICES DOES NOT CONSTITUTE AN ENDORSEMENT REGARDING THE SUITABILITY OF SUCH PRODUCTS OR SERVICES OR A WARRANTY, REPRESENTATION OR ENDORSEMENT OF SUCH PRODUCTS OR SERVICES, EITHER ALONEORINCOMBINATIONWITHANYTIPRODUCTORSERVICE. 13.2 Community Resources The following links connect to TI community resources. Linked contents are provided "AS IS" by the respective contributors. They do not constitute TI specifications and do not necessarily reflect TI's views; see TI's Terms of Use. TIE2E™OnlineCommunity TI'sEngineer-to-Engineer(E2E)Community.Createdtofostercollaboration amongengineers.Ate2e.ti.com,youcanaskquestions,shareknowledge,exploreideasandhelp solveproblemswithfellowengineers. DesignSupport TI'sDesignSupport QuicklyfindhelpfulE2Eforumsalongwithdesignsupporttoolsand contactinformationfortechnicalsupport. 13.3 Trademarks SmartGain,Nano-Free,E2EaretrademarksofTexasInstruments. Allothertrademarksarethepropertyoftheirrespectiveowners. 13.4 Electrostatic Discharge Caution Thesedeviceshavelimitedbuilt-inESDprotection.Theleadsshouldbeshortedtogetherorthedeviceplacedinconductivefoam duringstorageorhandlingtopreventelectrostaticdamagetotheMOSgates. 13.5 Glossary SLYZ022—TIGlossary. Thisglossarylistsandexplainsterms,acronyms,anddefinitions. 14 Mechanical, Packaging, and Orderable Information The following pages include mechanical, packaging, and orderable information. This information is the most current data available for the designated devices. This data is subject to change without notice and revision of thisdocument.Forbrowser-basedversionsofthisdatasheet,refertotheleft-handnavigation. 14.1 YZH Package Dimensions The package dimensions for this YZH package are shown in the table below. See the package drawing at the endofthisdatasheetformoredetails. PackagedDevices D E Max=2160µm Max=2137µm TPA2026D2YZH Min=2100µm Min=2077µm 36 SubmitDocumentationFeedback Copyright©2010–2016,TexasInstrumentsIncorporated ProductFolderLinks:TPA2026D2
PACKAGE OPTION ADDENDUM www.ti.com 29-Mar-2019 PACKAGING INFORMATION Orderable Device Status Package Type Package Pins Package Eco Plan Lead/Ball Finish MSL Peak Temp Op Temp (°C) Device Marking Samples (1) Drawing Qty (2) (6) (3) (4/5) TPA2026D2YZHR ACTIVE DSBGA YZH 16 3000 Green (RoHS SNAGCU Level-1-260C-UNLIM -40 to 85 NSV & no Sb/Br) TPA2026D2YZHT ACTIVE DSBGA YZH 16 250 Green (RoHS SNAGCU Level-1-260C-UNLIM -40 to 85 NSV & no Sb/Br) (1) The marketing status values are defined as follows: ACTIVE: Product device recommended for new designs. LIFEBUY: TI has announced that the device will be discontinued, and a lifetime-buy period is in effect. NRND: Not recommended for new designs. Device is in production to support existing customers, but TI does not recommend using this part in a new design. PREVIEW: Device has been announced but is not in production. Samples may or may not be available. OBSOLETE: TI has discontinued the production of the device. (2) RoHS: TI defines "RoHS" to mean semiconductor products that are compliant with the current EU RoHS requirements for all 10 RoHS substances, including the requirement that RoHS substance do not exceed 0.1% by weight in homogeneous materials. Where designed to be soldered at high temperatures, "RoHS" products are suitable for use in specified lead-free processes. TI may reference these types of products as "Pb-Free". RoHS Exempt: TI defines "RoHS Exempt" to mean products that contain lead but are compliant with EU RoHS pursuant to a specific EU RoHS exemption. Green: TI defines "Green" to mean the content of Chlorine (Cl) and Bromine (Br) based flame retardants meet JS709B low halogen requirements of <=1000ppm threshold. Antimony trioxide based flame retardants must also meet the <=1000ppm threshold requirement. (3) MSL, Peak Temp. - The Moisture Sensitivity Level rating according to the JEDEC industry standard classifications, and peak solder temperature. (4) There may be additional marking, which relates to the logo, the lot trace code information, or the environmental category on the device. (5) Multiple Device Markings will be inside parentheses. Only one Device Marking contained in parentheses and separated by a "~" will appear on a device. If a line is indented then it is a continuation of the previous line and the two combined represent the entire Device Marking for that device. (6) Lead/Ball Finish - Orderable Devices may have multiple material finish options. Finish options are separated by a vertical ruled line. Lead/Ball Finish values may wrap to two lines if the finish value exceeds the maximum column width. Important Information and Disclaimer:The information provided on this page represents TI's knowledge and belief as of the date that it is provided. TI bases its knowledge and belief on information provided by third parties, and makes no representation or warranty as to the accuracy of such information. Efforts are underway to better integrate information from third parties. TI has taken and continues to take reasonable steps to provide representative and accurate information but may not have conducted destructive testing or chemical analysis on incoming materials and chemicals. TI and TI suppliers consider certain information to be proprietary, and thus CAS numbers and other limited information may not be available for release. In no event shall TI's liability arising out of such information exceed the total purchase price of the TI part(s) at issue in this document sold by TI to Customer on an annual basis. Addendum-Page 1
PACKAGE OPTION ADDENDUM www.ti.com 29-Mar-2019 Addendum-Page 2
PACKAGE MATERIALS INFORMATION www.ti.com 29-Mar-2019 TAPE AND REEL INFORMATION *Alldimensionsarenominal Device Package Package Pins SPQ Reel Reel A0 B0 K0 P1 W Pin1 Type Drawing Diameter Width (mm) (mm) (mm) (mm) (mm) Quadrant (mm) W1(mm) TPA2026D2YZHR DSBGA YZH 16 3000 180.0 8.4 2.35 2.35 0.81 4.0 8.0 Q1 TPA2026D2YZHT DSBGA YZH 16 250 180.0 8.4 2.35 2.35 0.81 4.0 8.0 Q1 PackMaterials-Page1
PACKAGE MATERIALS INFORMATION www.ti.com 29-Mar-2019 *Alldimensionsarenominal Device PackageType PackageDrawing Pins SPQ Length(mm) Width(mm) Height(mm) TPA2026D2YZHR DSBGA YZH 16 3000 182.0 182.0 20.0 TPA2026D2YZHT DSBGA YZH 16 250 182.0 182.0 20.0 PackMaterials-Page2
D: Max = 2.164 mm, Min =2 .104 mm E: Max = 2.142 mm, Min =2 .082 mm
IMPORTANTNOTICEANDDISCLAIMER TIPROVIDESTECHNICALANDRELIABILITYDATA(INCLUDINGDATASHEETS),DESIGNRESOURCES(INCLUDINGREFERENCE DESIGNS),APPLICATIONOROTHERDESIGNADVICE,WEBTOOLS,SAFETYINFORMATION,ANDOTHERRESOURCES“ASIS” ANDWITHALLFAULTS,ANDDISCLAIMSALLWARRANTIES,EXPRESSANDIMPLIED,INCLUDINGWITHOUTLIMITATIONANY IMPLIEDWARRANTIESOFMERCHANTABILITY,FITNESSFORAPARTICULARPURPOSEORNON-INFRINGEMENTOFTHIRD PARTYINTELLECTUALPROPERTYRIGHTS. TheseresourcesareintendedforskilleddevelopersdesigningwithTIproducts.Youaresolelyresponsiblefor(1)selectingtheappropriate TIproductsforyourapplication,(2)designing,validatingandtestingyourapplication,and(3)ensuringyourapplicationmeetsapplicable standards,andanyothersafety,security,orotherrequirements.Theseresourcesaresubjecttochangewithoutnotice.TIgrantsyou permissiontousetheseresourcesonlyfordevelopmentofanapplicationthatusestheTIproductsdescribedintheresource.Other reproductionanddisplayoftheseresourcesisprohibited.NolicenseisgrantedtoanyotherTIintellectualpropertyrightortoanythird partyintellectualpropertyright.TIdisclaimsresponsibilityfor,andyouwillfullyindemnifyTIanditsrepresentativesagainst,anyclaims, damages,costs,losses,andliabilitiesarisingoutofyouruseoftheseresources. TI’sproductsareprovidedsubjecttoTI’sTermsofSale(www.ti.com/legal/termsofsale.html)orotherapplicabletermsavailableeitheron ti.comorprovidedinconjunctionwithsuchTIproducts.TI’sprovisionoftheseresourcesdoesnotexpandorotherwisealterTI’sapplicable warrantiesorwarrantydisclaimersforTIproducts. MailingAddress:TexasInstruments,PostOfficeBox655303,Dallas,Texas75265 Copyright©2019,TexasInstrumentsIncorporated

 Datasheet下载

