ICGOO在线商城 > 集成电路(IC) > 线性 - 放大器 - 仪表,运算放大器,缓冲器放大器 > OP249GP

 Datasheet下载
- 型号: OP249GP
- 制造商: Analog
- 库位|库存: xxxx|xxxx
- 要求:
| 数量阶梯 | 香港交货 | 国内含税 |
| +xxxx | $xxxx | ¥xxxx |
查看当月历史价格
查看今年历史价格
OP249GP产品简介:
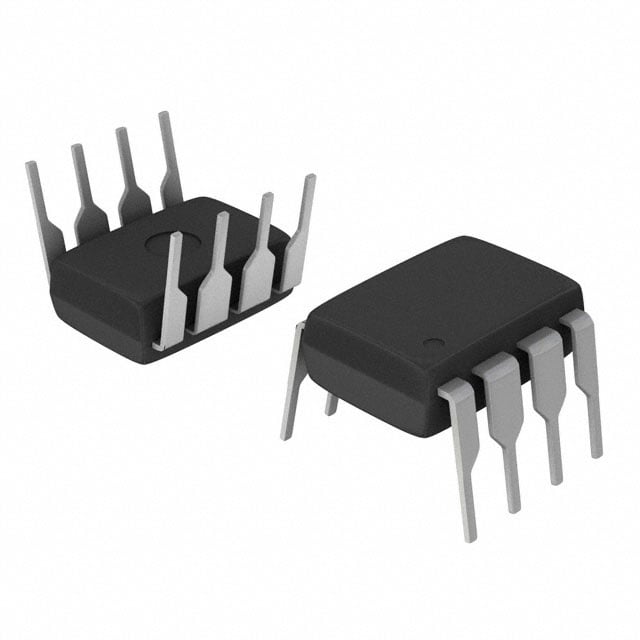
ICGOO电子元器件商城为您提供OP249GP由Analog设计生产,在icgoo商城现货销售,并且可以通过原厂、代理商等渠道进行代购。 OP249GP价格参考。AnalogOP249GP封装/规格:线性 - 放大器 - 仪表,运算放大器,缓冲器放大器, J-FET 放大器 2 电路 8-PDIP。您可以下载OP249GP参考资料、Datasheet数据手册功能说明书,资料中有OP249GP 详细功能的应用电路图电压和使用方法及教程。
| 参数 | 数值 |
| -3db带宽 | - |
| 产品目录 | 集成电路 (IC)半导体 |
| 描述 | IC OPAMP JFET 4.7MHZ 8DIP精密放大器 DUAL PREC JFET IC High Speed |
| 产品分类 | Linear - Amplifiers - Instrumentation, OP Amps, Buffer Amps集成电路 - IC |
| 品牌 | Analog Devices |
| 产品手册 | |
| 产品图片 |
|
| rohs | 否不符合限制有害物质指令(RoHS)规范要求 |
| 产品系列 | 放大器 IC,精密放大器,Analog Devices OP249GP- |
| 数据手册 | |
| 产品型号 | OP249GP |
| PCN过时产品 | |
| 产品培训模块 | http://www.digikey.cn/PTM/IndividualPTM.page?site=cn&lang=zhs&ptm=30008http://www.digikey.cn/PTM/IndividualPTM.page?site=cn&lang=zhs&ptm=26202 |
| 产品种类 | 精密放大器 |
| 供应商器件封装 | 8-PDIP |
| 共模抑制比—最小值 | 90 dB |
| 关闭 | No |
| 包装 | 管件 |
| 压摆率 | 22 V/µs |
| 双重电源电压 | +/- 15 V |
| 商标 | Analog Devices |
| 增益带宽生成 | 4.7 MHz |
| 增益带宽积 | 4.7MHz |
| 安装类型 | 通孔 |
| 安装风格 | Through Hole |
| 封装 | Tube |
| 封装/外壳 | 8-DIP(0.300",7.62mm) |
| 封装/箱体 | PDIP-8 |
| 工作温度 | -40°C ~ 85°C |
| 工作电源电压 | 9 V to 36 V |
| 工厂包装数量 | 50 |
| 放大器类型 | J-FET |
| 最大双重电源电压 | +/- 18 V |
| 最大工作温度 | + 85 C |
| 最小双重电源电压 | +/- 4.5 V |
| 最小工作温度 | - 40 C |
| 标准包装 | 50 |
| 电压-电源,单/双 (±) | ±4.5 V ~ 18 V |
| 电压-输入失调 | 200µV |
| 电压增益dB | 120.83 dB |
| 电流-电源 | 5.6mA |
| 电流-输入偏置 | 30pA |
| 电流-输出/通道 | 36mA |
| 电源电压-最大 | 36 V |
| 电源电压-最小 | 9 V |
| 电源电流 | 5.6 mA |
| 电源类型 | Dual |
| 电路数 | 2 |
| 系列 | OP249 |
| 视频文件 | http://www.digikey.cn/classic/video.aspx?PlayerID=1364138032001&width=640&height=505&videoID=2245193153001http://www.digikey.cn/classic/video.aspx?PlayerID=1364138032001&width=640&height=505&videoID=2245193159001 |
| 转换速度 | 22 V/us |
| 输入偏压电流—最大 | 75 pA |
| 输入补偿电压 | 400 uV |
| 输出电流 | 36 mA |
| 输出类型 | No |
| 通道数量 | 2 Channel |


- 商务部:美国ITC正式对集成电路等产品启动337调查
- 曝三星4nm工艺存在良率问题 高通将骁龙8 Gen1或转产台积电
- 太阳诱电将投资9.5亿元在常州建新厂生产MLCC 预计2023年完工
- 英特尔发布欧洲新工厂建设计划 深化IDM 2.0 战略
- 台积电先进制程称霸业界 有大客户加持明年业绩稳了
- 达到5530亿美元!SIA预计今年全球半导体销售额将创下新高
- 英特尔拟将自动驾驶子公司Mobileye上市 估值或超500亿美元
- 三星加码芯片和SET,合并消费电子和移动部门,撤换高东真等 CEO
- 三星电子宣布重大人事变动 还合并消费电子和移动部门
- 海关总署:前11个月进口集成电路产品价值2.52万亿元 增长14.8%


PDF Datasheet 数据手册内容提取
Precision JFET, High Speed, Dual Operational Amplifier Data Sheet OP249 FEATURES PIN CONFIGURATIONS Slew rate: 22 V/µs typical OUT A 1 OP249 8 V+ Settling time (0.01%): 1.2 µs maximum –IN A 2 A 7 OUT B OOTopftfesaenl th- lvaooromlpta oggnaeiic:n 2d: 01is00t o0µ0rVt V itoy/nmp:i V0c a.m0l 0 in2i%m utymp ical +INV A– 43 B 65 –+IINN BB 00296-001 Figure 1. 8-Lead CERDIP (Q-8) and 8-Lead PDIP (N-8) APPLICATIONS Output amplifier for fast DACs +IN A 1 8 –IN A Signal processing V– 2 A 7 OUT A Instrumentation amplifiers +IN B 3 OP249 6 V+ FAacsttiv sea mfilptelers- and-holds –IN B 4 B 5 OUT B 00296-002 Low distortion audio amplifiers Figure 2. 8-Lead SOIC (R-8) Input buffer for ADCs Servo controllers GENERAL DESCRIPTION The OP249 is a high speed, precision dual JFET op amp, similar Symmetrical slew rate, even when driving large load, such as, to the popular single op amp. The OP249 outperforms available 600 Ω or 200 pF of capacitance and ultralow distortion, make dual amplifiers by providing superior speed with excellent dc the OP249 ideal for professional audio applications, active filters, performance. Ultrahigh open-loop gain (1 kV/mV minimum), high speed integrators, servo systems, and buffer amplifiers. low offset voltage, and superb gain linearity makes the OP249 the industry’s first true precision, dual high speed amplifier. With a slew rate of 22 V/µs typical and a fast settling time of less than 1.2 µs maximum to 0.01%, the OP249 is an ideal choice for high speed bipolar DAC and ADC applications. The excellent dc performance of the OP249 allows the full accuracy of high resolution CMOS DACs to be realized. 0.01 870ns TA = 25°C VS = ±15V 100 VO = 10V p-p 100 90 RL = 10kΩ 90 AV = 1 10 10 0% 10mV 500ns 00296-003 0.001 00296-004 0% 5V 1µs 00296-005 20 100 1k 10k20k Figure 3. Fast Settling (0.01%) Figure 4. Low Distortion, AV = 1, RL = 10 kΩ Figure 5. Excellent Output Drive, RL = 600 Ω Rev. I Document Feedback Information furnished by Analog Devices is believed to be accurate and reliable. However, no responsibility is assumed by Analog Devices for its use, nor for any infringements of patents or other One Technology Way, P.O. Box 9106, Norwood, MA 02062-9106, U.S.A. rights of third parties that may result from its use. Specifications subject to change without notice. No license is granted by implication or otherwise under any patent or patent rights of Analog Devices. Tel: 781.329.4700 ©1989–2015 Analog Devices, Inc. All rights reserved. Trademarks and registered trademarks are the property of their respective owners. Technical Support www.analog.com
OP249 Data Sheet TABLE OF CONTENTS Features .............................................................................................. 1 Typical Performance Characteristics ..............................................7 Applications ....................................................................................... 1 Applications Information .............................................................. 13 Pin Configurations ........................................................................... 1 Open-Loop Gain Linearity ....................................................... 14 General Description ......................................................................... 1 Offset Voltage Adjustment ........................................................ 14 Revision History ............................................................................... 2 Settling Time ............................................................................... 14 Specifications ..................................................................................... 3 DAC Output Amplifier .............................................................. 15 Electrical Characteristics ............................................................. 3 Discussion on Driving ADCs ................................................... 16 Absolute Maximum Ratings ............................................................ 6 Outline Dimensions ....................................................................... 17 ESD Caution .................................................................................. 6 Ordering Guide .......................................................................... 18 REVISION HISTORY 10/15—Rev. H to Rev. I 9/01—Rev. D to Rev. E Changes to Features Section............................................................ 1 Edits to Features and Pin Connections .......................................... 1 Changes to Ordering Guide ............................................................ 8 Edits to Electrical Characteristics .............................................. 2, 3 Deleted Table 7 .................................................................................. 8 Edits to Absolute Maximum Ratings, Package Type, and Ordering Guide .................................................................................. 4 11/13—Rev. G to Rev. H Deleted Wafer Test Limits and Dice Characteristics Section ...... 5 Changes to Figure 39 and Figure 41 ............................................. 13 Edits to Typical Performance Characteristics ................................ 8 Edits to Macro-Model Figure ........................................................ 15 4/10—Rev. F to Rev. G Edits to Outline Dimensions......................................................... 17 Changes to Features Section and General Description Section . 1 Changes to Offset Voltage Parameter, Table 1 .............................. 3 Deleted Long Term Offset Voltage Parameter and Note 1, Table 1 ................................................................................... 3 Changes to Offset Voltage Parameter, Offset Voltage Temperature Coefficient Parameter, and Note 1, Table 3 ........... 5 Delete OP249F Columns, Table 3................................................... 5 Changes to Offset Voltage Parameter and Offset Voltage Temperature Coefficient Parameter, Table 4 ................................. 5 Inserted OP249F Columns, Table 4 ............................................... 5 Changes to Discussion on Driving ADCs Section ..................... 16 Deleted Figure 52 and Figure 53 ................................................... 17 5/07—Rev. E to Rev. F Updated Format .................................................................. Universal Changes to Table 1 ............................................................................ 3 Changes to Table 2 ............................................................................ 4 Changes to Table 3 and Table 4 ....................................................... 5 Changes to Table 5 ............................................................................ 6 Changes to Figure 31 ...................................................................... 11 Changes to Figure 37 and Figure 38 ............................................. 12 Deleted OP249 SPICE Macro-Model Section ............................ 14 Deleted Figure 18; Renumbered Sequentially............................. 14 Deleted Table I ................................................................................ 15 Changes to Discussion on Driving ADCs Section ..................... 17 Updated Outline Dimensions ....................................................... 18 Changes to Ordering Guide .......................................................... 19 Rev. I | Page 2 of 18
Data Sheet OP249 SPECIFICATIONS ELECTRICAL CHARACTERISTICS V = ±15 V, T = 25°C, unless otherwise noted. S A Table 1. OP249A OP249F Parameter Symbol Conditions Min Typ Max Min Typ Max Unit Offset Voltage V V = 0 V 0.2 0.75 0.2 0.9 mV OS CM Offset Stability 1.5 1.5 µV/month Input Bias Current I V = 0 V, T = 25°C 30 75 30 75 pA B CM A Input Offset Current I V = 0 V, T = 25°C 6 25 6 25 pA OS CM A Input Voltage Range1 IVR 12.5 12.5 V ±11 ±11 V −12.5 –12.5 V Common-Mode Rejection CMR V = ±11 V 80 90 80 90 dB CM Power-Supply Rejection Ratio PSRR V = ± 4.5 V to ±18 V 12 31.6 12 50 µV/V S Large Signal Voltage Gain A V = ±10 V, R = 2 kΩ 1000 1400 500 1200 V/mV VO O L Output Voltage Swing V R = 2 kΩ 12.5 12.5 V O L ±12.0 ±12.0 V −12.5 –12.5 V Short-Circuit Current Limit I Output shorted to 36 36 mA SC ground ±20 ±50 ±20 ±50 mA −33 –33 mA Supply Current I No load, V = 0 V 5.6 7.0 5.6 7.0 mA SY O Slew Rate SR R = 2 kΩ, C = 50 pF 18 22 18 22 V/µs L L Gain Bandwidth Product2 GBW 3.5 4.7 3.5 4.7 MHz Settling Time t 10 V step 0.01%3 0.9 1.2 0.9 1.2 µs S Phase Margin Θ 0 dB gain 55 55 Degrees M Differential Input Impedance Z 1012||6 1012||6 Ω||pF IN Open-Loop Output Resistance R 35 35 Ω O Voltage Noise e p-p 0.1 Hz to 10 Hz 2 2 µV p-p n Voltage Noise Density e f = 10 Hz 75 75 nV/√Hz n O f = 100 Hz 26 26 nV/√Hz O f = 1 kHz 17 17 nV/√Hz O f = 10 kHz 16 16 nV/√Hz O Current Noise Density i f = 1 kHz 0.003 0.003 pA/√Hz n O Voltage Supply Range V ±4.5 ±15 ±18 ±4.5 ±15 ±18 V S 1 Guaranteed by CMR test. 2 Guaranteed by design. 3 Settling time is sample tested. Rev. I | Page 3 of 18
OP249 Data Sheet V = ±15 V, T = 25°C, unless otherwise noted. S A Table 2. OP249G Parameter Symbol Conditions Min Typ Max Unit Offset Voltage V V = 0 V 0.4 2.0 mV OS CM Input Bias Current I V = 0 V, T = 25°C 40 75 pA B CM A Input Offset Current I V = 0 V T = 25°C 10 25 pA OS CM A Input Voltage Range1 IVR 12.5 V ±11 V −12.0 V Common-Mode Rejection CMR V = ±11 V 76 90 dB CM Power Supply Rejection Ratio PSRR V = ±4.5 V to ±18 V 12 50 µV/V S Large Signal Voltage Gain A V = ±10 V; R = 2 kΩ 500 1100 V/mV VO O L Output Voltage Swing V R = 2 kΩ 12.5 V O L ±12.0 V −12.5 V Short-Circuit Current Limit I Output shorted to ground 36 mA SC ±20 ±50 mA −33 mA Supply Current I No load; V = 0 V 5.6 7.0 mA SY O Slew Rate SR R = 2 kΩ, C = 50 pF 18 22 V/µs L L Gain Bandwidth Product2 GBW 4.7 MHz Settling Time t 10 V step 0.01% 0.9 1.2 µs S Phase Margin Θ 0 dB gain 55 Degree M Differential Input Impedance Z 1012||6 Ω||pF IN Open-Loop Output Resistance R 35 Ω O Voltage Noise e p-p 0.1 Hz to 10 Hz 2 μV p-p n Voltage Noise Density e f = 10 Hz 75 nV/√Hz n O f = 100 Hz 26 nV/√Hz O f = 1 kHz 17 nV/√Hz O f = 10 kHz 16 nV/√Hz O Current Noise Density i f = 1 kHz 0.003 pA/√Hz n O Voltage Supply Range V ±4.5 ±15 ±18 V S 1 Guaranteed by CMR test. 2 Guaranteed by design. Rev. I | Page 4 of 18
Data Sheet OP249 V = ±15 V, −55°C ≤ T ≤ +125°C for A grade, unless otherwise noted. S A Table 3. OP249A Parameter Symbol Conditions Min Typ Max Unit Offset Voltage V V = 0 V 0.12 1.0 mV OS CM Offset Voltage Temperature Coefficient TCV V = 0 V 1 10 μV/°C OS CM Input Bias Current1 I 4 20 nA B Input Offset Current1 I 0.04 4 nA OS Input Voltage Range2 IVR 12.5 V ±11 V −12.5 V Common-Mode Rejection CMR V = ±11 V 76 110 dB CM Power Supply Rejection Ratio PSRR V = ±4.5 V to ±18 V 5 50 μV/V S Large Signal Voltage Gain A R = 2 kΩ; V = ±10 V 500 1400 V/mV VO L O Output Voltage Swing V R = 2 kΩ 12.5 V O L ±12 V −12.5 V Supply Current I No load, V = 0 V 5.6 7.0 mA SY O 1 TA = 125°C. 2 Guaranteed by CMR test. V = ±15 V, −40°C ≤ T ≤ +85°C, unless otherwise noted. S A Table 4. OP249F OP249G Parameter Symbol Conditions Min Typ Max Min Typ Max Unit Offset Voltage V V = 0 V 0.5 1.1 1.0 3.6 mV OS CM Offset Voltage Temperature Coefficient TCV V = 0 V 2.2 12 6 25 μV/°C OS CM Input Bias Current1 I 0.3 4.0 0.5 4.5 nA B Input Offset Current1 I 0.02 1.2 0.04 1.5 nA OS Input Voltage Range2 IVR 12.5 12.5 V ±11 ±11 V −12.5 −12.5 V Common-Mode Rejection CMR V = ±11 V 80 90 76 95 dB CM Power Supply Rejection Ratio PSRR V = ±4.5 V to ±18 V 7 100 10 100 μV/V S Large Signal Voltage Gain A R = 2 kΩ; V = ±10 V 250 1200 250 1200 V/mV VO L O Output Voltage Swing V R = 2 kΩ 12.5 12.5 V O L ±12 ±12.0 V −12.5 −12.5 V Supply Current I No load, V = 0 V 5.6 7.0 5.6 7.0 mA SY O 1 TA = 85°C. 2 Guaranteed by CMR test. Rev. I | Page 5 of 18
OP249 Data Sheet ABSOLUTE MAXIMUM RATINGS Stresses at or above those listed under Absolute Maximum Table 5. Ratings may cause permanent damage to the product. This is a Parameter1 Rating stress rating only; functional operation of the product at these Supply Voltage ±18 V or any other conditions above those indicated in the operational Input Voltage2 ±18 V section of this specification is not implied. Operation beyond Differential Input Voltage2 36 V the maximum operating conditions for extended periods may Output Short-Circuit Duration Indefinite affect product reliability. Storage Temperature Range −65°C to +175°C Operating Temperature Range Table 6. Thermal Resistance OP249A (Q) −55°C to +125°C Package Type θ 1 θ Unit JA JC OP249F (Q) −40°C to +85°C 8-Lead CERDIP (Q) 134 12 °C/W OP249G (N, R) −40°C to +85°C 8-Lead PDIP (N) 96 37 °C/W Junction Temperature Range 8-Lead SOIC (R) 150 41 °C/W OP249A (Q), OP249F (Q) −65°C to +175°C OP249G (N, R) −65°C to +150°C 1 θJA is specified for worst-case mounting conditions, that is, θJA is specified for device in socket for CERDIP and PDIP packages; θJA is specified for device Lead Temperature (Soldering, 60 sec) 300°C soldered to printed circuit board for SOIC package. 1 Absolute maximum ratings apply to packaged parts, unless otherwise noted. ESD CAUTION 2 For supply voltages less than ±18 V, the absolute maximum input voltage is equal to the supply voltage. Rev. I | Page 6 of 18
Data Sheet OP249 TYPICAL PERFORMANCE CHARACTERISTICS 120 120 TA = 25°C TA = 25°C VS = ±15V VS = ±15V 100 RL = 2kΩ B) 100 d B) 80 0 ON ( N (d CTI 80 N-LOOP GAI 6400 GPHAAINSE 4950 PHASE (°C) UPPLY REJE 60 –PSRR+PSRR OPE 20 Θm = 55 135 ER S 40 W O P 20 0 180 –20 225 0 00296-009 1k 10k F1R00EkQUENCY 1(HMz) 10M 100M 00296-006 10 100 FR1kEQUENCY 1(H0kz) 100k 1M Figure 6. Open-Loop Gain, Phase vs. Frequency Figure 9. Power Supply Rejection vs. Frequency 65 10 28 VS = ±15V VS = ±15V RL = 2kΩ Hz) 26 CL = 50pF M 60 8 T ( ARGIN (°C) 55 Θm 6 H PRODUC ATE (V/µs) 2224 –SR PHASE M GBW ANDWIDT SLEW R 20 +SR B 50 4 N AI G 18 45 2 16 00296-010 –75 –50 –25 TE0MPERA25TURE (5°0C) 75 100 125 00296-007 –75 –50 –25 TE0MPERA25TURE (5°0C) 75 100 125 Figure 7. Phase Margin, Gain Bandwidth Product vs. Temperature Figure 10. Slew Rate vs. Temperature 140 28 TA = 25°C TA = 25°C VS = ±15V VS = ±15V B) 120 26 RL = 2kΩ d EJECTION ( 10800 E (V/µs) 24 ODE R 60 W RAT 22 M E N- SL 20 O M 40 M O C 18 200 00296-008 16 00296-011 100 1k 10k 100k 1M 10M 0 0.2 0.4 0.6 0.8 1.0 FREQUENCY (Hz) DIFFERENTIAL INPUT VOLTAGE (V) Figure 8. Common-Mode Rejection vs. Frequency Figure 11. Slew Rate vs. Differential Input Voltage Rev. I | Page 7 of 18
OP249 Data Sheet 35 0.01 TA = 25°C TA = 25°C VS = ±15V VS = ±15V 30 VO = 10V p-p RL = 10kΩ AV = 1 s) 25 NEGATIVE µ V/ E ( T A 20 POSITIVE R W E L S 15 10 5 00296-012 0.001 00296-015 0 100 200 300 400 500 20 100 1k 10k 20k CAPACITIVE LOAD (pF) Figure 12. Slew Rate vs. Capacitive Load Figure 15. Distortion vs. Frequency 10 0.01 TA = 25°C TA = 25°C 8 VS = ±15V VS = ±15V AVCL = 1 VO = 10V p-p 6 RL = 2kΩ ZE (V) 4 0.1% 0.01% AV = 1 SI 2 P E T 0 S T U –2 TP 0.01% OU –4 0.1% –6 –1–08 00296-013 0.001 00296-016 0 200 400 600 800 1000 20 100 1k 10k 20k SETTLING TIME (ns) Figure 13. Step Size vs. Settling Time Figure 16. Distortion vs. Frequency 100 TA = 25°C 0.01 VS = ±15V TA = 25°C nV/Hz) 80 VVROSL === ±6110050VVΩ p-p Y ( AV = 1 T SI 60 N E D E S OI 40 N E G A T OL 20 V 00 100 1k 10k00296-014 0.001 00296-017 FREQUENCY (Hz) 20 100 1k 10k 20k Figure 14. Voltage Noise Density vs. Frequency Figure 17. Distortion vs. Frequency Rev. I | Page 8 of 18
Data Sheet OP249 0.1 500mV 1s TA = 25°C VS = ±15V VO = 10V p-p RL = 10kΩ AV = 1 +1µV –1µV 0.01 00296-018 BANDWIDTH (0.1Hz TO 10Hz) 00296-021 20 100 1k 10k 20k TA = 25°C, VS = ±15V Figure 18. Distortion vs. Frequency Figure 21. Low Frequency Noise 60 0.1 TA = 25°C TA = 25°C 50 VS = ±15V VS = ±15V VRAOLV === 211k00ΩV p-p N (dB) 40 AVCL = 100 AI 30 G P AVCL = 10 O 20 O L D- AVCL = 5 E 10 S O L C 0 AVCL = 1 0.01 00296-019 ––12001k 10k 100k 1M 10M 100M00296-022 20 100 1k 10k 20k FREQUENCY (Hz) Figure 19. Distortion vs. Frequency Figure 22. Closed-Loop Gain vs. Frequency 50 0.1 TA = 25°C TA = 25°C VS = ±15V VS = ±15V VO = 10V p-p 40 RL = 600kΩ AV = 10 Ω) E ( 30 NC AVCL = 1 A D E P 20 IM AVCL = 10 10 0.01 00296-020 0100 1k AVCL =1 01k00 100k 1M 10M00296-023 20 100 1k 10k 20k FREQUENCY (Hz) Figure 20. Distortion vs. Frequency Figure 23. Closed-Loop Output Impedance vs. Frequency Rev. I | Page 9 of 18
OP249 Data Sheet 30 20 TA = 25°C 15 RL = 2kΩ 25 E (V p-p) 20 SWING (V) 105 T VOLTAG 15 AD8512 VOLTAGE 0 OUTPU 10 UTPUT –1–05 OP249 O 5 0 AD712 00296-024 ––2105 00296-027 1k 1M 10M 0 ±5 ±10 ±15 ±20 FREQUENCY (Hz) SUPPLY VOLTAGE (V) Figure 24. Output Voltage vs. Frequency Figure 27. Output Voltage Swing vs. Supply Voltage 90 6.0 VS = ±15V VS = ±15V 80 RL = 2kΩ NO LOAD VIN = 100mV p-p 70 A) 5.8 T (%) 60 ANEVCGLA =T I1VE EDGE NT (m ERSHOO 5400 APOVCSLI T=I V1E EDGE Y CURRE 5.6 V L O 30 PP U S 5.4 20 100 AVCL = 5 00296-025 5.2 00296-028 0 100 200 300 400 500 –75 –50 –25 0 25 50 75 100 125 LOAD CAPACITANCE (pF) TEMPERATURE (°C) Figure 25. Small Overshoot vs. Load Capacitance Figure 28. Supply Current vs. Temperature 16 6.0 TA = 25°C 14 VS = ±15V V) 5.8 G ( 12 A) T SWIN 10 +VOHM = |–VOHM| ENT (m 5.6 TA = +25°C UM OUTPU 86 PLY CURR 5.4 TA = +125°C M P XI SU MA 4 TA = –55°C 5.2 02 00296-026 5.0 00296-029 100 1k 10k 0 5 10 15 20 LOAD RESISTANCE (Ω) SUPPLY VOLTAGE (V) Figure 26. Maximum Output Voltage Swing vs. Load Resistance Figure 29. Supply Current vs. Supply Voltage Rev. I | Page 10 of 18
Data Sheet OP249 180 10k TA = 25°C VS = ±15V 160 VS = ±15V VCM = 0V 415 × OP249 140 (830 OP AMPS) A) 1k p 120 T ( N E R S 100 R NIT CU 100 U 80 S A BI 60 T U P N 10 40 I 200 00296-030 1 00296-033 –1000 –800 –600 –400 –200 0 200 400 600 800 1000 –75 –50 –25 0 25 50 75 100 125 VOS (µV) TEMPERATURE (°C) Figure 30. VOS Distribution (N-8) Figure 33. Input Bias Current vs. Temperature 300 104 270 –V4S0 =°C ± 1T5OV +85°C TVAS == 2±51°5CV 240 (830 OP AMPS) 103 210 A) p 180 T ( S N T E UNI 150 URR 102 120 S C A 90 BI 101 60 300 00296-031 100 00296-034 0 2 4 6 8 10 12 14 16 18 20 22 24 –15 –10 –5 0 5 10 15 TCVOS (µV/°C) COMMON-MODE VOLTAGE (V) Figure 31. TCVOS Distribution (N-8) Figure 34. Bias Current vs. Common-Mode Voltage 50 50 TA = 25°C VS = ±15V VS = ±15V 40 40 V) pA) E (µ NT ( AG 30 RE 30 T R L U O C T V AS FSE 20 T BI 20 F U O P N I 10 10 0 00296-032 0 00296-035 0 1 2 3 4 5 0 2 4 6 8 10 TIME AFTER POWER APPLIED (Minutes) TIME AFTER POWER APPLIED (Minutes) Figure 32. Offset Voltage Warm-Up Drift Figure 35. Bias Current Warm-Up Drift Rev. I | Page 11 of 18
OP249 Data Sheet 80 80 TA = 25°C VS = ±15V VCM = 0V mA) SOURCE RENT (pA) 60 CURRENT ( 60 SINK R T U U C P SET 40 OUT 40 NPUT OFF 20 T-CIRCUIT 20 I R O 0 00296-036 SH 0 00296-038 –75 –50 –25 0 25 50 75 100 125 –75 –50 –25 0 25 50 75 100 125 TEMPERATURE (°C) TEMPERATURE (°C) Figure 36. Input Offset Current vs. Temperature Figure 38. Short-Circuit Output Current vs. Junction Temperature 12000 VS = ±15V 10000 V) m V/ 8000 N ( GAI RL = 10kΩ P 6000 O O EN-L 4000 RL = 2kΩ P O 2000 0 00296-037 –75 –50 –25 0 25 50 75 100 125 TEMPERATURE (°C) Figure 37. Open-Loop Gain vs. Temperature Rev. I | Page 12 of 18
Data Sheet OP249 APPLICATIONS INFORMATION V+ +IN 100 90 –IN VOUT 10 0% 5V 1µs A) OP249 100 90 V– 00296-039 Figure 39. Simplified Schematic (1/2 OP249) 10 0% 2OP1/2249 1 5V B) LT1057 1µs 00296-041 +3V 3 5kΩ Figure 41. Large-Signal Transient Response, AV = 1, VIN = 20 V p-p, ZL = 2 kΩ//200 pF, VS = ±15 V The OP249 was carefully designed to provide symmetrically +18V matched slew characteristics in both the negative and positive 6 8 directions, even when driving a large output load. 1/2 OP249 7 The slewing limitation of the amplifier determines the maximum +3V 5 4 –18V 5kΩ 00296-040 fsrigeqnuifeicnacnyt adti wsthorictiho na .s Hinouwsoeivdearl, oitu itsp iumt pcoanrt abnet o tbot anionteed t whaitth tohuet Figure 40. Burn-In Circuit nonsymmetric slewing typical of previously available JFET amplifiers adds a higher series of harmonic energy content to The OP249 represents a reliable JFET amplifier design, the resulting response—and an additional dc output component. featuring an excellent combination of dc precision and high Examples of potential problems of nonsymmetric slewing behavior speed. A rugged output stage provides the ability to drive a can be in audio amplifier applications, where a natural low dis- 600 Ω load and still maintain a clean ac response. The OP249 tortion sound quality is desired and in servo or signal processing features a large signal response that is more linear and symmetric systems where a net dc offset cannot be tolerated. The linear than previously available JFET input amplifiers. Figure 41 and symmetric slewing feature of the OP249 makes it an ideal compares the large signal response of the OP249 to other choice for applications that exceed the full power bandwidth industry-standard dual JFET amplifiers. range of the amplifier. Typically, the slewing performance of the JFET amplifier is specified as a number of V/µs. There is no discussion on the quality, that is, linearity and symmetry of the slewing response. Rev. I | Page 13 of 18
OP249 Data Sheet R4 +V R3 VIN 100 1/2 90 R1 OP249 VOUT R5 200kΩ 50kΩ R2 R2 –V 31Ω VOS ADJUST RANGE = ±V R1 00296-044 Figure 44. Offset Adjustment for Inverting Amplifier Configuration +V 10 R5 0% R1 50mV 1µs 00296-042 50kRΩ3 200kΩR2 R4 OP12/249 VOUT Figure 42. Small-Signal Transient Response, 33Ω AV = 1, ZL = 2 kΩ||100 pF, No Compensation, VS = ±15 V –V R2 As with most JFET input amplifiers, the output of the OP249 VIN VOS ADJUST RANGE = ±V R1 GAIN = VOUT = 1 + R5 cianampnpu ultin fvdioeerlrt, ganogoe pr r hdaaonseeg sei n.i tPv echraasusioseen i naifnv ee iirntshtieeorrn ni nadplo uleatst ecnxhoc-etu edpda scm othnaegd esitp tiehocnei f. ied =1 + RR54VIIFN R2 << R4R4 + R2 00296-045 Figure 45. Offset Adjustment for Noninverting Amplifier Configuration Supply decoupling should be used to overcome inductance and In Figure 44, the offset adjustment is made by supplying a small resistance associated with supply lines to the amplifier. A 0.1 µF voltage at the noninverting input of the amplifier. Resistors R1 and a 10 µF capacitor should be placed between each supply pin and R2 attenuate the potentiometer voltage, providing a ±2.5 mV and ground. (with V = ±15 V) adjustment range, referred to the input. S OPEN-LOOP GAIN LINEARITY Figure 45 shows the offset adjustment for the noninverting The OP249 has both an extremely high open-loop gain of amplifier configuration, also providing a ±2.5 mV adjustment 1 kV/mV minimum and constant gain linearity, which enhances its range. As shown in the equations in Figure 45, if R4 is not much dc precision and provides superb accuracy in high closed-loop greater than R2, a resulting closed-loop gain error must be gain applications. Figure 43 illustrates the typical open-loop accounted for. gain linearity—high gain accuracy is assured, even when SETTLING TIME driving a 600 Ω load. The settling time is the time between when the input signal begins OFFSET VOLTAGE ADJUSTMENT to change and when the output permanently enters a prescribed The inherent low offset voltage of the OP249 makes offset error band. The error bands on the output are 5 mV and 0.5 mV, adjustments unnecessary in most applications. However, where respectively, for 0.1% and 0.01% accuracy. a lower offset error is required, balancing can be performed Figure 46 shows the settling time of the OP249, which is typically with simple external circuitry, as shown in Figure 44 and Figure 45. 870 ns. Moreover, problems in settling response, such as thermal tails and long-term ringing, are nonexistent. VERTICAL 50µV/DIV INPUT VARIATION 870ns 100 90 10 HOOURTIZPOUNTT CAHLA 5RVG/DEIV 00296-043 0% 10mV 500ns 00296-046 Figure 43. Open-Loop Gain Linearity; Variation in Open-Loop Gain Results in Figure 46. Settling Characteristics of the OP249 to 0.01% Errors in High Closed-Loop Gain Circuits; RL = 600 Ω, VS = ±15 V Rev. I | Page 14 of 18
Data Sheet OP249 DAC OUTPUT AMPLIFIER Because the DAC output capacitance appears at the inputs of the op amp, it is essential that the amplifier be adequately Unity-gain stability, a low offset voltage of 300 µV typical, and a compensated. Compensation increases the phase margin and fast settling time of 870 ns to 0.01%, makes the OP249 an ideal ensures an optimal overall settling response. The required lead amplifier for fast DACs. compensation is achieved with Capacitor C in Figure 48. For CMOS DAC applications, the low offset voltage of the OP249 results in excellent linearity performance. CMOS DACs, such as the PM7545, typically have a code-dependent output resistance variation between 11 kΩ and 33 kΩ. The change in output resistance, in conjunction with the 11 kΩ feedback resistor, results in a noise gain change, which causes variations in the offset error, increasing linearity errors. The OP249 features low offset voltage error, minimizing this effect and maintaining 12-bit linearity performance over the full-scale range of the converter. VDD 0.1µF 75Ω C +15V 18 20 33pF 0.1µF VDD RFB OUT1 1 2 8 REFEROERN VCIEN 500Ω 19 VREF PM7545 OP1/2249 1 VOUT AGND 2 3 4 0.1µF DB11 TO DB0 DGND 3 DATA1 2INPUT –15V 00296-047 Figure 47. Fast Settling and Low Offset Error of the OP249 Enhances CMOS DAC Performance—Unipolar Operation R4 20kΩ 1% VDD R5 0.1µF 75Ω 10kΩ 1% C +15V 18 20 33pF 0.1µF VDD RFB R3 REFEROERN VCIEN 500Ω 19 VREF PM7545OUT1 1 2OP1/22849 1 110%kΩ 5 1/2 AGND 2 3 OP249 7 VOUT DB11 TO DB0 DGND 6 4 0.1µF 3 DATA1 I2NPUT –15V 00296-048 Figure 48. Fast Settling and Low Offset Error of the OP249 Enhances CMOS DAC Performance—Bipolar Operation Rev. I | Page 15 of 18
OP249 Data Sheet A B 4µs 4µs 100 100 90 90 10 10 0% 0% 500mV 1µs 500mV 1µs RESPONSAEN DIS EGXRHCOI B=SI ST5LSpYF R UINNGDIENRGDAMPED, FAST RISEO TFI MSLEI GCHHTA RPAECCA =TK E1INR5GpISF ITNIC RSE, SBPUOTN ASTE EXPENSE 00296-049 Figure 49. Effect of Altering Compensation from Circuit in Figure 47—PM7545 CMOS DAC with 1/2 OP249, Unipolar Operation; Critically Damped Response Is Obtained with C ≈ 33 pF Figure 49 illustrates the effect of altering the compensation on +15V 0.1µF the output response of the circuit in Figure 47. Compensation is required to address the combined effect of the output capacitance 3 8 1/2 of the DAC, the input capacitance of the op amp, and any stray OP249 1 7A13 PLUG-IN capacitance. Slight adjustments to the compensation capacitor may 2 4 0.1µF be required to optimize settling response for any given application. * 7A13 PLUG-IN –15V The settling time of the combination of the current output DAC 300pF 1kΩ and the op amp can be approximated by ( ) ( ) +15V ΔIOUT =|V1RkEΩF| t TOTAL= t DAC 2 + t AMP 2 S S S 1.5kΩ The actual overall settling time is affected by the noise gain of TTL INPUT 2N3904 the amplifier, the applied compensation, and the equivalent 1N4148 2N2907 10µF 1kΩ + input capacitance at the input of the amplifier. 1.8kΩ +15V 220Ω DISCUSSION ON DRIVING ADCs 0.1µF 0.01µF 0.47µF Settling characteristics of op amps also include the ability of the * laomadpl icfoienrd tiot iroenco. vAenr, ethxaatm isp, lsee totfle t,h friso min cal utrdaenss iaenn to cpu arrmenpt doruitvpiuntg *DPLEACNOEU PWLIET HC LSOHOSER TT OLEGAEDT HLEERN GOTNH GSR.OUND VREF 00296-050 the input from a SAR-type ADC. Although the comparison Figure 50. Transient Output Impedance Test Fixture point of the converter is usually diode clamped, the input swing of plus-and-minus a diode drop still gives rise to a significant As seen in Figure 51, the OP249 has an extremely fast recovery modulation of input current. If the closed-loop output impedance of 247 ns (to 0.01%) for a 1 mA load transient. The performance is low enough and bandwidth of the amplifier is sufficiently makes it an ideal amplifier for data acquisition systems. large, the output settles before the converter makes a comparison decision, which prevents linearity errors or missing codes. 247.4ns Figure 50 shows a settling measurement circuit for evaluating 100 90 recovery from an output current transient. An output disturbing current generator provides the transient change in output load current of 1 mA. 10 0% 2mV 2V 100ns 00296-051 Figure 51. Transient Recovery Time of the OP249 from a 1 mA Load Transient to 0.01% Rev. I | Page 16 of 18
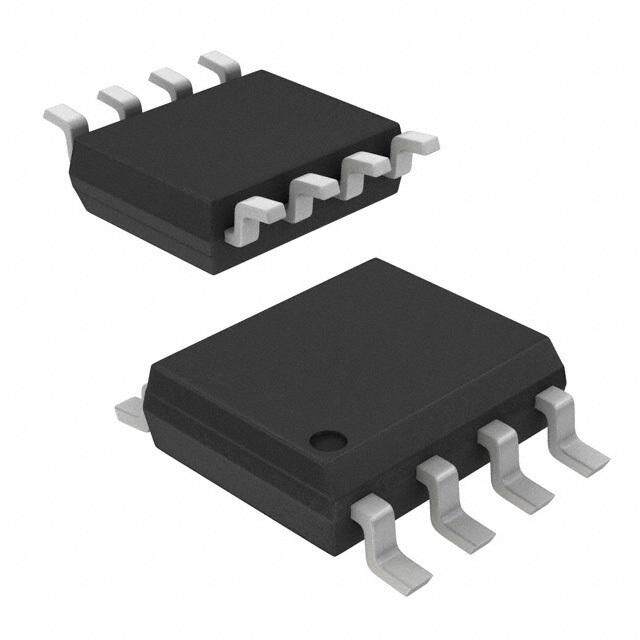
Data Sheet OP249 OUTLINE DIMENSIONS 0.400 (10.16) 0.365 (9.27) 0.355 (9.02) 8 5 0.280 (7.11) 0.250 (6.35) 1 4 0.240 (6.10) 0.325 (8.26) 0.310 (7.87) 0.100 (2.54) 0.300 (7.62) BSC 0.060 (1.52) 0.195 (4.95) 0.210 (5.33) MAX 0.130 (3.30) MAX 0.115 (2.92) 0.015 0.150 (3.81) (0.38) 0.015 (0.38) 0.130 (3.30) MIN GAUGE 0.115 (2.92) SEATING PLANE 0.014 (0.36) PLANE 0.010 (0.25) 0.022 (0.56) 0.008 (0.20) 0.005 (0.13) 0.430 (10.92) 0.018 (0.46) MIN MAX 0.014 (0.36) 0.070 (1.78) 0.060 (1.52) 0.045 (1.14) COMPLIANTTO JEDEC STANDARDS MS-001 CONTROLLING DIMENSIONSARE IN INCHES; MILLIMETER DIMENSIONS (RCINEOFRPEANRREERENN LCTEEHA EODSNSEL MSY)AAAYNR BDEE AR CROOEU NNNFODIGETUDAR-POEPFDRFOA INSPC RWHIAH ETOEQL UFEIO VORAR LU EHSNAETL ISFN FLDOEEARSDIGSN.. 070606-A Figure 52. 8-Lead Plastic Dual In-Line Package [PDIP] Narrow Body (N-8) Dimensions shown in inches and (millimeters) 5.00(0.1968) 4.80(0.1890) 8 5 4.00(0.1574) 6.20(0.2441) 3.80(0.1497) 1 4 5.80(0.2284) 1.27(0.0500) 0.50(0.0196) BSC 1.75(0.0688) 0.25(0.0099) 45° 0.25(0.0098) 1.35(0.0532) 8° 0.10(0.0040) 0° COPLANARITY 0.51(0.0201) 0.10 SEATING 0.31(0.0122) 0.25(0.0098) 10..2470((00..00510507)) PLANE 0.17(0.0067) COMPLIANTTOJEDECSTANDARDSMS-012-AA C(RINOEFNPEATRRREOENNLCLTEIHNEOGSNDELISYM)AEANNRDSEIAORRNOESUNANORDETEDAIN-POMPFRIFLOLMPIMIRLELIATIMTEEERTFSEO;RIRNECUQHSUEDIVIINMAELDENENSSTIIOGSNNFS.OR 012407-A Figure 53. 8-Lead Standard Small Outline Package [SOIC_N] Narrow Body (R-8) Dimensions shown in millimeters and (inches) Rev. I | Page 17 of 18
OP249 Data Sheet 0.005 (0.13) 0.055 (1.40) MIN MAX 8 5 0.310 (7.87) 0.220 (5.59) 1 4 0.100 (2.54) BSC 0.405 (10.29) MAX 0.320 (8.13) 0.290 (7.37) 0.200 (5.08) 0.060 (1.52) MAX 0.015 (0.38) 0.200 (5.08) 0.150 (3.81) MIN 0.125 (3.18) 0.015 (0.38) 00..002134 ((00..5386)) 0.070 (1.78) SPELAANTIENG 1 05°° 0.008 (0.20) 0.030 (0.76) CONTROLLING DIMENSIONS ARE IN INCHES; MILLIMETER DIMENSIONS (IN PARENTHESES) ARE ROUNDED-OFF INCH EQUIVALENTS FOR REFERENCE ONLY AND ARE NOT APPROPRIATE FOR USE IN DESIGN. Figure 54. 8-Lead Ceramic Dual In-Line Package [CERDIP] (Q-8) Dimensions shown in inches and (millimeters) ORDERING GUIDE Model1 Temperature Range Package Description Package Option OP249AZ −55°C to +125°C 8-Lead CERDIP Q-8 OP249FZ −40°C to +85°C 8-Lead CERDIP Q-8 OP249GPZ −40°C to +85°C 8-Lead PDIP N-8 OP249GSZ −40°C to +85°C 8-Lead SOIC_N R-8 OP249GSZ-REEL −40°C to +85°C 8-Lead SOIC_N R-8 OP249GSZ-REEL7 −40°C to +85°C 8-Lead SOIC_N R-8 1 The OP249GPZ, OP249GSZ, OP249GSZ-REEL, and OP249GSZ-REEL7 are RoHS compliant parts. ©1989–2015 Analog Devices, Inc. All rights reserved. Trademarks and registered trademarks are the property of their respective owners. D00296-0-10/15(I) Rev. I | Page 18 of 18