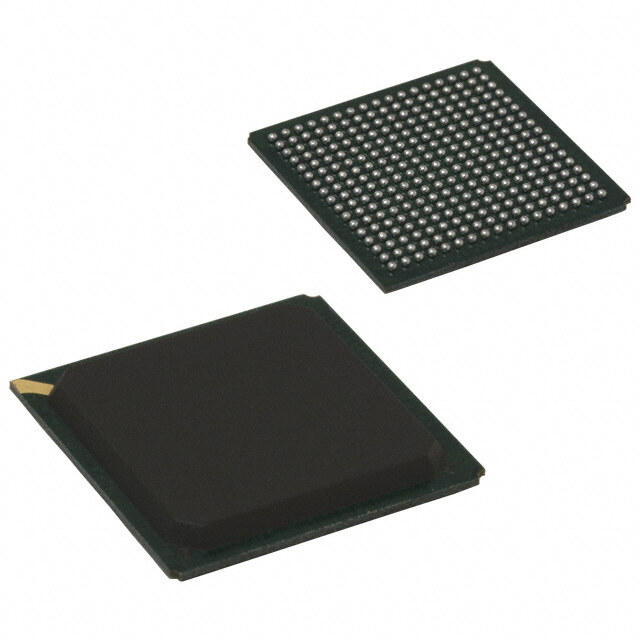
- 型号: AD8232ACPZ-R7
- 制造商: Analog
- 库位|库存: xxxx|xxxx
- 要求:
| 数量阶梯 | 香港交货 | 国内含税 |
| +xxxx | $xxxx | ¥xxxx |
查看当月历史价格
查看今年历史价格
AD8232ACPZ-R7产品简介:
ICGOO电子元器件商城为您提供AD8232ACPZ-R7由Analog设计生产,在icgoo商城现货销售,并且可以通过原厂、代理商等渠道进行代购。 AD8232ACPZ-R7价格参考¥19.81-¥19.81。AnalogAD8232ACPZ-R7封装/规格:专用 IC, ECG Front End 20-LFCSP-WQ (4x4)。您可以下载AD8232ACPZ-R7参考资料、Datasheet数据手册功能说明书,资料中有AD8232ACPZ-R7 详细功能的应用电路图电压和使用方法及教程。
| 参数 | 数值 |
| 产品目录 | 集成电路 (IC) |
| 描述 | IC AFE HEART MONITOR 20LFCSP |
| 产品分类 | |
| 品牌 | Analog Devices Inc |
| 数据手册 | |
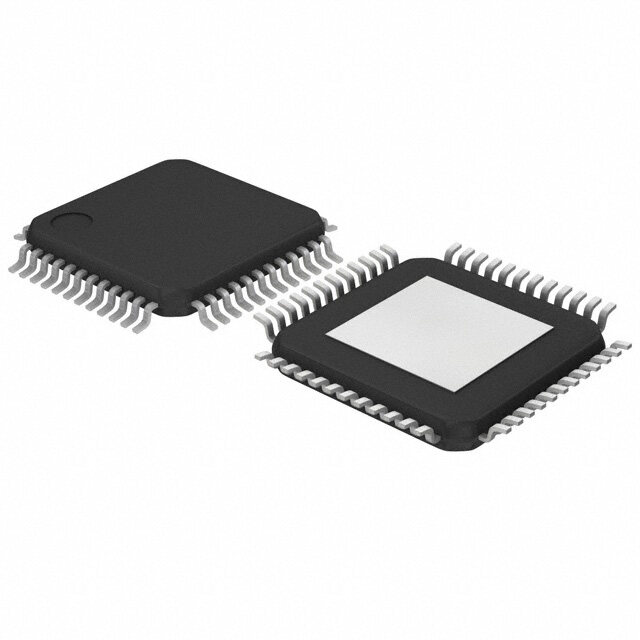
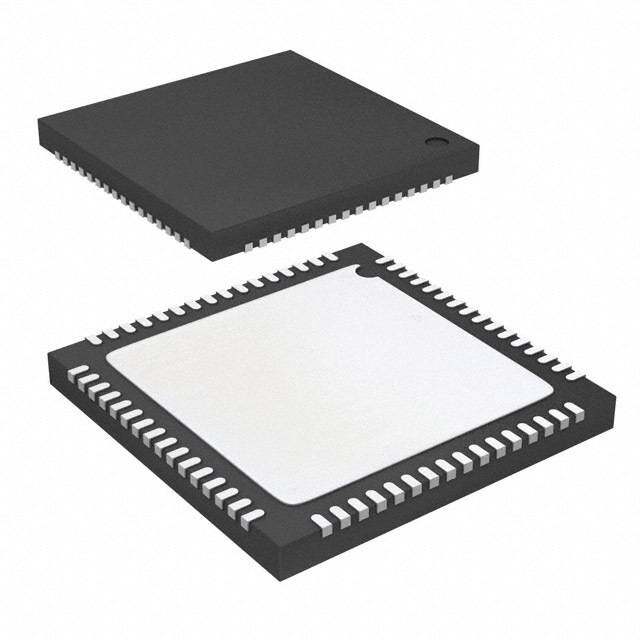
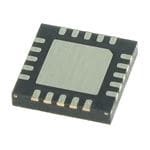
| 产品图片 |
|
| 产品型号 | AD8232ACPZ-R7 |
| PCN组件/产地 | |
| rohs | 无铅 / 符合限制有害物质指令(RoHS)规范要求 |
| 产品系列 | - |
| 供应商器件封装 | 20-LFCSP-WQ(4x4) |
| 其它名称 | AD8232ACPZ-R7DKR |
| 包装 | Digi-Reel® |
| 安装类型 | 表面贴装 |
| 封装/外壳 | 20-WFQFN 裸露焊盘,CSP |
| 应用 | 心率监测 |
| 标准包装 | 1 |
| 类型 | ECG 前端 |
| 视频文件 | http://www.digikey.cn/classic/video.aspx?PlayerID=1364138032001&width=640&height=505&videoID=2245193184001http://www.digikey.cn/classic/video.aspx?PlayerID=1364138032001&width=640&height=505&videoID= 2474683255001 |




- 商务部:美国ITC正式对集成电路等产品启动337调查
- 曝三星4nm工艺存在良率问题 高通将骁龙8 Gen1或转产台积电
- 太阳诱电将投资9.5亿元在常州建新厂生产MLCC 预计2023年完工
- 英特尔发布欧洲新工厂建设计划 深化IDM 2.0 战略
- 台积电先进制程称霸业界 有大客户加持明年业绩稳了
- 达到5530亿美元!SIA预计今年全球半导体销售额将创下新高
- 英特尔拟将自动驾驶子公司Mobileye上市 估值或超500亿美元
- 三星加码芯片和SET,合并消费电子和移动部门,撤换高东真等 CEO
- 三星电子宣布重大人事变动 还合并消费电子和移动部门
- 海关总署:前11个月进口集成电路产品价值2.52万亿元 增长14.8%


PDF Datasheet 数据手册内容提取
Single-Lead, Heart Rate Monitor Front End Data Sheet AD8232 FEATURES FUNCTIONAL BLOCK DIAGRAM Fully integrated single-lead ECG front end 20 19 18 17 16 Low supply current: 170 µA (typical) HPSENSE IAOUT REFIN +VS GND HPDRIVE Common-mode rejection ratio: 80 dB (dc to 60 Hz) 1 S110kΩ A3 FR 15 Two or three electrode configurations +IN 2 High signal gain (G = 100) with dc blocking capabilities –IN IA AC/DC 14 2-pole adjustable high-pass filter 3 Accepts up to ±300 mV of half cell potential 150kΩ AD8232 SDN 13 Fast restore feature improves filter settling 4 Uncommitted op amp LOD+ RLDFB 3-pole adjustable low-pass filter with adjustable gain C1 12 Leads off detection: ac or dc options 5 A2 LDEEATEDCST-OIOFNF RLD LOD– Integrated right leg drive (RLD) amplifier C2 11 Single-supply operation: 2.0 V to 3.5 V S2 Integrated reference buffer generates virtual ground 10kΩ A1 RInatiel-rtnoa-lr aRiFl Io fuilttpeur t SW 6 OPAMP+7 REFOUT8OPAMP–9 OUT10 10866-001 Figure 1. 8 kV HBM ESD rating Shutdown pin 20-lead 4 mm × 4 mm LFCSP package APPLICATIONS Fitness and activity heart rate monitors Portable ECG Remote health monitors Gaming peripherals Biopotential signal acquisition GENERAL DESCRIPTION The AD8232 is an integrated signal conditioning block for ECG To improve common-mode rejection of the line frequencies in and other biopotential measurement applications. It is designed the system and other undesired interferences, the AD8232 to extract, amplify, and filter small biopotential signals in the includes an amplifier for driven lead applications, such as right presence of noisy conditions, such as those created by motion or leg drive (RLD). remote electrode placement. This design allows for an ultralow The AD8232 includes a fast restore function that reduces the power analog-to-digital converter (ADC) or an embedded duration of otherwise long settling tails of the high-pass filters. microcontroller to acquire the output signal easily. After an abrupt signal change that rails the amplifier (such as a The AD8232 can implement a two-pole high-pass filter for leads off condition), the AD8232 automatically adjusts to a eliminating motion artifacts and the electrode half-cell potential. higher filter cutoff. This feature allows the AD8232 to recover This filter is tightly coupled with the instrumentation architec- quickly, and therefore, to take valid measurements soon after ture of the amplifier to allow both large gain and high-pass connecting the electrodes to the subject. filtering in a single stage, thereby saving space and cost. The AD8232 is available in a 4 mm × 4 mm, 20-lead LFCSP An uncommitted operational amplifier enables the AD8232 to package. Performance is specified from 0°C to 70°C and is create a three-pole low-pass filter to remove additional noise. operational from −40°C to +85°C. The user can select the frequency cutoff of all filters to suit different types of applications. Rev. C Document Feedback Information furnished by Analog Devices is believed to be accurate and reliable. However, no responsibility is assumed by Analog Devices for its use, nor for any infringements of patents or other One Technology Way, P.O. Box 9106, Norwood, MA 02062-9106, U.S.A. rights of third parties that may result from its use. Specifications subject to change without notice. No license is granted by implication or otherwise under any patent or patent rights of Analog Devices. Tel: 781.329.4700 ©2012–2018 Analog Devices, Inc. All rights reserved. Trademarks and registered trademarks are the property of their respective owners. Technical Support www.analog.com
AD8232 Data Sheet TABLE OF CONTENTS Features .............................................................................................. 1 Standby Operation ..................................................................... 19 Applications ....................................................................................... 1 Input Protection ......................................................................... 19 Functional Block Diagram .............................................................. 1 Radio Frequency Interference (RFI) ........................................ 20 General Description ......................................................................... 1 Power Supply Regulation and Bypassing ................................ 20 Revision History ............................................................................... 2 Input Referred Offsets ............................................................... 20 Specifications ..................................................................................... 3 Layout Recommendations ........................................................ 20 Absolute Maximum Ratings ............................................................ 5 Applications Information .............................................................. 21 ESD Caution .................................................................................. 5 Eliminating Electrode Offsets .................................................. 21 Pin Configuration and Function Descriptions ............................. 6 High-Pass Filtering .................................................................... 21 Typical Performance Characteristics ............................................. 7 Low-Pass Filtering and Gain ..................................................... 23 Instrumentation Amplifier Performance Curves ..................... 7 Driving Analog-to-Digital Converters .................................... 23 Operational Amplifier Performance Curves .......................... 10 Driven Electrode ........................................................................ 23 Right Leg Drive (RLD) Amplifier Performance Curves ....... 13 Application Circuits ....................................................................... 24 Reference Buffer Performance Curves .................................... 14 Heart Rate Measurement Next to the Heart ........................... 24 System Performance Curves ..................................................... 15 Exercise Application: Heart Rate Measured at the Hands .... 24 Theory of Operation ...................................................................... 16 Cardiac Monitor Configuration ............................................... 25 Architecture Overview .............................................................. 16 Portable Cardiac Monitor with Elimination of Motion Instrumentation Amplifier ........................................................ 16 Artifacts ....................................................................................... 25 Operational Amplifier ............................................................... 16 Packaging and Ordering Information ......................................... 27 Right Leg Drive Amplifier ......................................................... 17 Outline Dimensions ................................................................... 27 Reference Buffer ......................................................................... 17 Ordering Guide .......................................................................... 27 Fast Restore Circuit .................................................................... 17 Leads Off Detection ................................................................... 18 REVISION HISTORY 6/2018—Rev. B to Rev. C Changes to Figure 49...................................................................... 19 Changes to Figure 24 ...................................................................... 10 Changes to AC Leads Off Detection Section and Standby Changes to Radio Frequency Interference (RFI) Section ......... 20 Operation Section........................................................................... 20 Updated Outline Dimensions ....................................................... 27 Changes to Input Referred Offsets Section ................................. 21 Changes to Figure 53 and High-Pass Filtering Section ............. 22 3/2017—Rev. A to Rev. B Changes to Additional High-Pass Filtering Options Section; Updated Outline Dimensions ....................................................... 27 Added Table 4 ................................................................................. 23 Changes to Ordering Guide .......................................................... 27 Changes to Low-Pass Filtering and Gain Section; Added Driving Analog-to-Digital Converters Section and Figure 61................ 24 2/2013—Rev. 0 to Rev. A Changes to Figure 62, Figure 64, and Heart Rate Measurement Changes to Table 1 ............................................................................ 4 Next to the Heart Section .............................................................. 25 Changes to Table 2 ............................................................................ 6 Changes to Exercise Application: Heart Rate Measured at the Change to Figure 17 ......................................................................... 9 Hands and Figure 66 ...................................................................... 26 Changes to Figure 22 and Figure 25............................................. 11 Changes to Figure 68...................................................................... 27 Changes to Figure 34 and Figure 36............................................. 14 Changes to Figure 45, Architecture Overview Section, and 8/2012—Revision 0: Initial Version Instrumentation Amplifier Section .............................................. 17 Changes to Right Leg Drive Amplifier Section, Reference Buffer Section, Fast Restore Circuit Section, and Figure 48; Added Figure 46, Renumbered Sequentially ........................................... 18 Rev. C | Page 2 of 28
Data Sheet AD8232 SPECIFICATIONS V = 3 V, V = 1.5 V, V = 1.5 V, T = 25°C, FR=low, SDN=high, AC/DC = low, unless otherwise noted. S REF CM A Table 1. Parameter Symbol Test Conditions/Comments Min Typ Max Unit INSTRUMENTATION AMPLIFIER Common-Mode Rejection Ratio, CMRR V = 0.35 V to 2.85 V, V = 0 V 80 86 dB CM DIFF DC to 60 Hz V = 0.35 V to 2.85 V, V = ±0.3 V 80 dB CM DIFF Power Supply Rejection Ratio PSRR V = 2.0 V to 3.5 V 76 90 dB S Offset Voltage (RTI) V OS Instrumentation Amplifier Inputs 3 8 mV DC Blocking Input1 5 50 µV Average Offset Drift Instrumentation Amplifier Inputs 10 µV/°C DC Blocking Input1 0.05 µV/°C Input Bias Current I 50 200 pA B T = 0°C to 70°C 1 nA A Input Offset Current I 25 100 pA OS T = 0°C to 70°C 1 nA A Input Impedance Differential 10||7.5 GΩ||pF Common Mode 5||15 GΩ||pF Input Voltage Noise (RTI) Spectral Noise Density f = 1 kHz 100 nV/√Hz Peak-to-Peak Voltage Noise f = 0.1 Hz to 10 Hz 12 µV p-p f = 0.5 Hz to 40 Hz 14 µV p-p Input Voltage Range T = 0°C to 70°C 0.2 +V V A S DC Differential Input Range V −300 +300 mV DIFF Output Output Swing R = 50 kΩ 0.1 +V − 0.1 V L S Short-Circuit Current I 6.3 mA OUT Gain A 100 V/V V Gain Error V = 0 V 0.4 % DIFF V = −300 mV to +300 mV 1 3.5 % DIFF Average Gain Drift T = 0°C to 70°C 12 ppm/°C A Bandwidth BW 2 kHz RFI Filter Cutoff (Each Input) 1 MHz OPERATIONAL AMPLIFIER (A1) Offset Voltage V 1 5 mV OS Average TC T = 0°C to 70°C 5 µV/°C A Input Bias Current I 100 pA B T = 0°C to 70°C 1 nA A Input Offset Current I 100 pA OS T = 0°C to 70°C 1 nA A Input Voltage Range 0.1 +V − 0.1 V S Common-Mode Rejection Ratio CMRR V = 0.5 V to 2.5 V 100 dB CM Power Supply Rejection Ratio PSRR 100 dB Large Signal Voltage Gain A 110 dB VO Output Voltage Range R = 50 kΩ 0.1 +V − 0.1 V L S Short-Circuit Current Limit I 12 mA OUT Gain Bandwidth Product GBP 100 kHz Slew Rate SR 0.02 V/µs Voltage Noise Density (RTI) e f = 1 kHz 60 nV/√Hz n Peak-to-Peak Voltage Noise (RTI) e f = 0.1 Hz to 10 Hz 6 µV p-p n p-p f = 0.5 Hz to 40 Hz 8 µV p-p Rev. C | Page 3 of 28
AD8232 Data Sheet Parameter Symbol Test Conditions/Comments Min Typ Max Unit RIGHT LEG DRIVE AMPLIFIER (A2) Output Swing R = 50 kΩ 0.1 +V − 0.1 V L S Short-Circuit Current I 11 mA OUT Integrator Input Resistor 120 150 180 kΩ Gain Bandwidth Product GDP 100 kHz REFERENCE BUFFER (A3) Offset Error V R > 50 kΩ 1 mV OS L Input Bias Current I 100 pA B Short-Circuit Current Limit I 12 mA OUT Voltage Range R = 50 kΩ 0.1 +V − 0.7 V L S DC LEADS OFF COMPARATORS Threshold Voltage +V − 0.5 V S Hysteresis 60 mV Propagation Delay 0.5 µs AC LEADS OFF DETECTOR Square Wave Frequency F 50 100 175 kHz AC Square Wave Amplitude I 200 nA p-p AC Impedance Threshold Between +IN and −IN 10 20 MΩ Detection Delay 110 μs FAST RESTORE CIRCUIT Switches S1 and S2 On Resistance R 8 10 12 kΩ ON Off Leakage 100 pA Window Comparator Threshold Voltage From either rail 50 mV Propagation Delay 2 µs Switch Timing Characteristics Feedback Recovery Switch On Time t 110 ms SW1 Filter Recovery Switch On Time t 55 ms SW2 Fast Restore Reset t 2 µs RST LOGIC INTERFACE Input Characteristics Input Voltage (AC/DC and FR) Low V 1.24 V IL High V 1.35 V IH Input Voltage (SDN) Low V 2.1 V IL High V 0.5 V IH Output Characteristics LOD+ and LOD− terminals Output Voltage Low V 0.05 V OL High V 2.95 V OH SYSTEM SPECIFICATIONS Quiescent Supply Current 170 230 µA T = 0°C to 70°C 210 µA A Shutdown Current 40 500 nA T = 0°C to 70°C 100 nA A Supply Range 2.0 3.5 V Specified Temperature Range 0 70 °C Operational Temperature Range −40 +85 °C 1 Offset referred to the input of the instrumentation amplifier inputs. See the Input Referred Offsets section for additional information. Rev. C | Page 4 of 28
Data Sheet AD8232 ABSOLUTE MAXIMUM RATINGS Stresses at or above those listed under Absolute Maximum Table 2. Ratings may cause permanent damage to the product. This is a Parameter Rating stress rating only; functional operation of the product at these Supply Voltage 3.6 V or any other conditions above those indicated in the operational Output Short-Circuit Current Duration Indefinite section of this specification is not implied. Operation beyond Maximum Voltage, Any Terminal1 +V + 0.3 V S the maximum operating conditions for extended periods may Minimum Voltage, Any Terminal1 −0.3 V affect product reliability. Storage Temperature Range −65°C to +125°C Operating Temperature Range −40°C to +85°C ESD CAUTION Maximum Junction Temperature 140°C θ Thermal Impedance2 48°C/W JA θ Thermal Impedance 4.4°C/W JC ESD Rating Human Body Model (HBM) 8 kV Charged Device Model (FICDM) 1.25 kV Machine Model (MM) 200 V 1 This level or the maximum specified supply voltage, whichever is the lesser, indicates the superior voltage limit for any terminal. If input voltages beyond the specified minimum or maximum voltages are expected, place resistors in series with the inputs to limit the current to less than 5 mA. 2 θJA is specified for a device in free air on a 4-layer JEDEC board. Rev. C | Page 5 of 28
AD8232 Data Sheet PIN CONFIGURATION AND FUNCTION DESCRIPTIONS E S HPSENIAOUTREFIN+VSGND 09876 21111 HPDRIVE 1 15 FR +IN 2 AD8232 14 AC/DC –IN 3 TOP VIEW 13 SDN RLDFB 4 (Not to Scale) 12 LOD+ RLD 5 11 LOD– 67890 1 W+T–T SMPOUMPOU AFA PEP ORO N1.O LCTEOEANSVNEE CUTN CTOHNEN EEXCPTOESDE.D PAD TO GND OR 10866-002 Figure 2. Pin Configuration Table 3. Pin Function Descriptions Pin No. Mnemonic Description 1 HPDRIVE High-Pass Driver Output. Connect HPDRIVE to the capacitor in the first high-pass filter. The AD8232 drives this pin to keep HPSENSE at the same level as the reference voltage. 2 +IN Instrumentation Amplifier Positive Input. +IN is typically connected to the left arm (LA) electrode. 3 −IN Instrumentation Amplifier Negative Input. −IN is typically connected to the right arm (RA) electrode. 4 RLDFB Right Leg Drive Feedback Input. RLDFB is the feedback terminal for the right leg drive circuit. 5 RLD Right Leg Drive Output. Connect the driven electrode (typically, right leg) to the RLD pin. 6 SW Fast Restore Switch Terminal. Connect this terminal to the output of the second high-pass filter. 7 OPAMP+ Operational Amplifier Noninverting Input. 8 REFOUT Reference Buffer Output. The instrumentation amplifier output is referenced to this potential. Use REFOUT as a virtual ground for any point in the circuit that needs a signal reference. 9 OPAMP− Operational Amplifier Inverting Input. 10 OUT Operational Amplifier Output. The fully conditioned heart rate signal is present at this output. OUT can be connected to the input of an ADC. 11 LOD− Leads Off Comparator Output. In dc leads off detection mode, LOD− is high when the electrode to −IN is disconnected, and it is low when connected. In ac leads off detection mode, LOD− is always low. 12 LOD+ Leads Off Comparator Output. In dc leads off detection mode, LOD+ is high when the +IN electrode is disconnected, and it is low when connected. In ac leads off detection mode, LOD+ is high when either the −IN or +IN electrode is disconnected, and it is low when both electrodes are connected. 13 SDN Shutdown Control Input. Drive SDN low to enter the low power shutdown mode. 14 AC/DC Leads Off Mode Control Input. Drive the AC/DC pin low for dc leads off mode. Drive the AC/DC pin high for ac leads off mode. 15 FR Fast Restore Control Input. Drive FR high to enable fast recovery mode; otherwise, drive it low. 16 GND Power Supply Ground. 17 +V Power Supply Terminal. S 18 REFIN Reference Buffer Input. Use REFIN, a high impedance input terminal, to set the level of the reference buffer. 19 IAOUT Instrumentation Amplifier Output Terminal. 20 HPSENSE High-Pass Sense Input for Instrumentation Amplifier. Connect HPSENSE to the junction of R and C that sets the corner frequency of the dc blocking circuit. EP Exposed Pad. Connect the exposed pad to GND or leave it unconnected. Rev. C | Page 6 of 28
Data Sheet AD8232 TYPICAL PERFORMANCE CHARACTERISTICS V = 3 V, V = 1.5 V, V = 1.5 V, T = 25°C, unless otherwise noted. S REF CM A INSTRUMENTATION AMPLIFIER PERFORMANCE CURVES 1200 50 40 1000 30 A) 800 T (p 20 N RE 10 S R NIT 600 CU 0 U S A BI –10 400 T PU –20 N I –30 200 –40 –0120 –90 –60 –30CMRR0 (µV/V)30 60 90 120 10866-003 –500 0.5 INPU1T.0 COMM1O.5N-MOD2E.0 VOLTA2G.5E (V) 3.0 3.5 10866-006 Figure 3. Instrumentation Amplifier CMRR Distribution Figure 6. Instrumentation Amplifier Input Bias Current vs. CMV 50 NO DC OFFSET 300mV OFFSET 1400 40 1200 30 1000 B) UNITS 800 GAIN (d 20 600 10 400 0 200 0–2.0 –1.5 –1.0 –0G.5AIN ER0ROR (%0.)5 1.0 1.5 2.0 10866-004 –101 10 F1R0E0QUENCY (1Hkz) 10k 100k 10866-007 Figure 4. Instrumentation Amplifier Gain Error Distribution Figure 7. Instrumentation Amplifier Gain vs. Frequency 3.5 120 V) 3.0 E ( 100 AG 2.5 T L O E V 2.0 B) 80 D d N-MO 1.5 MRR ( O C 60 M 1.0 M O C T 0.5 U 40 P IN 0 N+3O0 0DmCV O OFFFFSSEETT –300mV OFFSET –0.50 0.5 1.0OUTP1U.5T VOLT2A.0GE (V)2.5 3.0 3.5 10866-005 2010 100 FREQUE1NkCY (Hz) 10k 100k 10866-008 Figure 5. Instrumentation Amplifier Figure 8. Instrumentation Amplifier CMRR vs. Frequency, RTI Input Common-Mode Range vs. Output Voltage Rev. C | Page 7 of 28
AD8232 Data Sheet 120 110 100 90 B) 80 10µV/DIV d R ( 70 R S P 60 50 40 23000.1 1 10FREQU1E0N0CY (Hz)1k 10k 100k 10866-009 200ms/DIV 10866-012 Figure 9. Instrumentation Amplifier PSRR vs. Frequency Figure 12. Instrumentation Amplifier 0.5 Hz to 40 Hz Noise 10k 1.0 0.9 0.8 0.7 1k √Hz) R (%) 0.6 V/ O NOISE (n AIN ERR 00..45 100 G 0.3 0.2 0.1 10.1 1 10FREQU1E0N0CY (Hz)1k 10k 100k 10866-010 00 50 100DC OFF1S50ET (mV)200 250 300 10866-013 Figure 10. Instrumentation Amplifier Voltage Noise Spectral Density (RTI) Figure 13. Instrumentation Amplifier Gain Error vs. DC Offset 22pF 470pF 1nF 10µV/DIV 1s/DIV 10866-011 100µs/DIV 50mV/DIV 10866-014 Figure 11. Instrumentation Amplifier 0.1 Hz to 10 Hz Noise Figure 14. Instrumentation Amplifier Small Signal Pulse Response Rev. C | Page 8 of 28
Data Sheet AD8232 4.0 0.8 IB 3.5 IOS 0.7 3.0 0.6 A) NT (nA) 2.5 0.5 ENT (n RE 2.0 0.4 RR R U CU 1.5 0.3 T C BIAS 1.0 0.2 FFSE UT 0.5 0.1 T O P U N P I 0 0 IN 0.5V/DIV 100µs/DIV 10866-015 ––10..05–40 –20 –0 TEM2P0ERATUR4E0 (°C) 60 80 100––00..21 10866-018 Figure 15. Instrumentation Amplifier Large Signal Pulse Response Figure 18. Instrumentation Amplifier Input Bias Current and Input Offset Current vs. Temperature 1.5 0.5 0.4 1.0 0.3 0.2 NG (V) 0.5 R (%) 0.1 WI O TPUT S 0 AIN ERR –0.10 OU –0.5 G –0.2 –0.3 –1.0 –40-°C +25°C +85°C –0.4 –1.5100 1k LOA10Dk (Ω) 100k 1M 10866-016 –0.5–40 –20 0 TEMP20ERATUR4E0 (°C) 60 80 100 10866-019 Figure 16. Instrumentation Amplifier Output Swing vs. Load Figure 19. Instrumentation Amplifier Gain Error vs. Temperature 0.4 50 40 0.3 V) m 30 T ( 0.2 E 20 S F OF 0.1 V) 10 T V/ U µ NP 0 R ( 0 NG I –0.1 CMR –10 KI OC –20 L –0.2 B C –30 D –0.3 –40 –0.4–40 –20 0 TEM2P0ERATUR4E0 (°C) 60 80 100 10866-017 –50–40 –20 0 TEM2P0ERATUR4E0 (°C) 60 80 100 10866-020 Figure 17. Instrumentation Amplifier DC Blocking Input Offset Drift Figure 20. Instrumentation Amplifier CMRR vs. Temperature Rev. C | Page 9 of 28
AD8232 Data Sheet OPERATIONAL AMPLIFIER PERFORMANCE CURVES 1000 800 600 S T NI U 400 200 0 –4 –2OFFSET VO0LTAGE (mV)2 4 10866-021 100µs/DIV 0.5V/DIV 10866-024 Figure 21. Operational Amplifier Offset Distribution Figure 24. Operational Amplifier Large Signal Transient Response 140 180 10k GAIN PHASE MARGIN 120 160 100 140 s) e dB) 6800 110200 N (Degre V/√Hz) 1k GAIN ( 40 80 E MARGI NOISE (n 20 60 S 100 A H 0 40 P –20 20 –400.1 1 10 FR1E0Q0UENCY1 k(Hz) 10k 100k 1M0 10866-022 100.1 1 10FREQU1E0N0CY (Hz)1k 10k 100k 10866-025 Figure 22. Operational Amplifier Open-Loop Gain and Phase vs. Figure 25. Operational Amplifier Voltage Spectral Noise Density vs. Frequency Frequency 22pF 470pF 1nF 5µV/DIV 10µS/DIV 50mV/DIV 10866-023 1s/DIV 10866-026 Figure 23. Operational Amplifier Small Signal Response for Figure 26. Operational Amplifier 0.1 Hz to 10 Hz Noise Various Capacitive Loads Rev. C | Page 10 of 28
Data Sheet AD8232 120 110 100 90 80 5µV/DIV B) 70 d R ( 60 R PS 50 40 30 20 200ms/DIV 10866-027 1000.1 1 10FREQU1E0N0CY (Hz)1k 10k 100k 10866-030 Figure 27. Operational Amplifier 0.5 Hz to 40 Hz Noise Figure 30. Operational Amplifier Power Supply Rejection Ratio 100 80 60 A) T (p 40 N E 20 R R CU 0 S BIA –20 T U –40 P N I –60 –1–08000 0.5 INPU1T.0 COMM1O.5N-MOD2E. 0VOLTA2G.5E (V) 3.0 3.5 10866-028 2100VµV/D/DIVIV 10866-031 Figure 28. Operational Amplifier Bias Current vs. Input Figure 31. Operational Amplifier Load Transient Response Common-Mode Voltage (100 μA Load Change) 1.5 0.8 0.6 1.0 0.4 V) 0.5 G ( V) 0.2 N m SWI 0 ET ( 0 T S U F TP OF –0.2 OU –0.5 –0.4 –1.0 –40-°C +25°C –0.6 +85°C –1.5100 1k LOA10Dk (Ω) 100k 1M 10866-029 –0.8–40 –20 0 TEM2P0ERATUR4E0 (°C) 60 80 100 10866-032 Figure 29. Operational Amplifier Output Voltage Swing vs. Figure 32. Operational Amplifier Offset vs. Temperature Output Current Rev. C | Page 11 of 28
AD8232 Data Sheet 10,000 A)1,000 p T ( N E R R CU 100 S A BI T U P N 10 I 1–40 –20 0 TEMP20ERATUR4E0 (°C) 60 80 100 10866-033 Figure 33. Operational Amplifier Bias Current vs. Temperature Rev. C | Page 12 of 28
Data Sheet AD8232 RIGHT LEG DRIVE (RLD) AMPLIFIER PERFORMANCE CURVES 140 180 GAIN PHASE 120 160 100 140 B) N (d 80 120 es) P GAI 60 100 Degre 5µV/DIV N-LOO 40 80 HASE ( E 20 60 P P O 0 40 ––24000.01 0.1 1 1F0REQU1E0N0CY (H1zk) 10k 100k 1M200 10866-034 1s/DIV 10866-037 Figure 34. RLD Amplifier Open-Loop Gain and Phase vs. Figure 37. RLD Amplifier 0.1 Hz to 10 Hz Noise Frequency 1.5 1.0 G (V) 0.5 5µV/DIV N WI S 0 T U P T OU –0.5 –1.0 –40-°C +25°C –1.5100 1k LOA10Dk (Ω) 100k +85°C1M 10866-035 200ms/DIV 10866-038 Figure 35. RLD Amplifier Output Voltage Swing vs. Figure 38. RLD Amplifier 0.5 Hz to 40 Hz Noise Output Current 10k 1k z) H √ V/ n E ( S OI N 100 100.1 1 10FREQU1E0N0CY (Hz)1k 10k 100k 10866-036 Figure 36. RLD Amplifier Voltage Spectral Noise Density vs. Frequency Rev. C | Page 13 of 28
AD8232 Data Sheet REFERENCE BUFFER PERFORMANCE CURVES 20 10,000.0 SOURCE 15 SINK 1,000.0 10 mV) E (Ω) R ( 5 NC 100.0 UT ERRO 0 T IMPEDA 10.0 P –5 U UT TP O U –10 O 1.0 –15 –200.01 0.L10OAD CURRENT (mA1) 10 10866-039 0.10.1 1 10FREQU1E0N0CY (Hz)1k 10k 100k 10866-041 Figure 39. Reference Buffer Load Regulation Figure 41. Reference Buffer Output Impedance vs. Frequency 1000 A) p T ( 100 N E R R U C S A BI T 10 U P N I 2100µmsV/D/DIVIV 10866-040 1–40 –20 0 TEMP20ERATUR4E0 (°C) 60 80 100 10866-042 Figure 40. Reference Buffer Figure 42. Reference Buffer Bias Current vs. Temperature Load Transient Response (100 μA Load Change) Rev. C | Page 14 of 28
Data Sheet AD8232 SYSTEM PERFORMANCE CURVES 240 200 VS = 2V 180 VS = 3V 220 VS = 3.5V 160 A) RENT (µA) 128000 RRENT (n 112400 UR CU 100 C N LY 160 OW 80 SUPP 140 HUTD 60 S 40 120 VS = 2V VS = 3V 20 VS = 3.5V 100–40 –20 0 TEMP20ERATUR4E0 (°C) 60 80 100 10866-043 0–40 –20 0 TEMP20ERATUR4E0 (°C) 60 80 100 10866-044 Figure 43. Supply Current vs. Temperature Figure 44. Shutdown Current vs. Temperature Rev. C | Page 15 of 28
AD8232 Data Sheet THEORY OF OPERATION +VS HPDRIVE HPSENSE IAOUT SW OPAMP+ OPAMP– 17 1 20 19 6 7 9 10kΩ +VS CHARGE PUMP A1 10 OUT S2 AC/DC –IN 2 RFI HPA 10kΩ +IN 3 FILTER GM1 GM2 R S1 15 FR VCM +V – 0.05V AC/DC 99R S 13 SDN C1 0.05V INSTRUMENTATIONAMPLIFIER (IA) 14 AC/DC S1 SWITCH SYNCH S2 TIMING RECTIFIER 12 LOD+ RLDFB 4 0.7V 11 LOD– RLD 5 A2 150kΩ +VS – 0.5V AC/DC 16 GND REFIN 18 A3 8 REFOUT *AL=L R SEWFIOTUCTHES SHOWN IN DC LEADS-OFF DETECTION POSITION AND FAST RESTORE DISABLED 10866-045 Figure 45. Simplified Schematic Diagram ARCHITECTURE OVERVIEW The feedback of the amplifier is applied via GM2 through two separate paths: the two resistors divide the output signal to set The AD8232 is an integrated front end for signal conditioning an overall gain of 100, whereas the dc blocking amplifier integrates of cardiac biopotentials for heart rate monitoring. It consists of any deviation from the reference level. Consequently, dc offsets a specialized instrumentation amplifier (IA), an operational as large as ±300 mV across the GM1 inputs appear inverted and amplifier (A1), a right leg drive amplifier (A2), and a midsupply with the same magnitude across the inputs of GM2, all without reference buffer (A3). In addition, the AD8232 includes leads saturating the signal of interest. off detection circuitry and an automatic fast restore circuit that brings back the signal shortly after leads are reconnected. To increase the common-mode voltage range of the instrumen- tation amplifier, a charge pump boosts the supply voltage for the The AD8232 contains a specialized instrumentation amplifier two transconductance amplifiers. This further prevents saturation that amplifies the ECG signal while rejecting the electrode half-cell of the amplifier in the presence of large common-mode signals, potential on the same stage. This is possible with an indirect such as line interference. The charge pump runs from an internal current feedback architecture, which reduces size and power oscillator, the frequency of which is set around 500 kHz. compared with traditional implementations OPERATIONAL AMPLIFIER INSTRUMENTATION AMPLIFIER This general-purpose operational amplifier (A1) is a rail-to-rail The instrumentation amplifier is shown in Figure 45 as device that can be used for low-pass filtering and to add additional comprised by two well-matched transconductance amplifiers gain. The following sections provide details and example circuits (GM1 and GM2), the dc blocking amplifier (HPA), and an that use this amplifier. integrator formed by C1 and an op amp. The transconductance amplifier, GM1, generates a current that is proportional to the voltage present at its inputs. When the feedback is satisfied, an equal voltage appears across the inputs of the transconductance amplifier, GM2, thereby matching the current generated by GM1. The difference generates an error current that is integrated across Capacitor C1. The resulting voltage appears at the output of the instrumentation amplifier. Rev. C | Page 16 of 28
Data Sheet AD8232 RIGHT LEG DRIVE AMPLIFIER the voltage at the output of the instrumentation amplifier is this reference voltage. The right leg drive (RLD) amplifier inverts the common-mode signal that is present at the instrumentation amplifier inputs. The reference voltage level is set at the REFIN pin. It can be set When the right leg drive output current is injected into the with a voltage divider or by driving the REFIN pin from some subject, it counteracts common-mode voltage variations, thus other point in the circuit (for example, from the ADC reference). improving the common-mode rejection of the system. The voltage is available at the REFOUT pin for the filtering circuits or for an ADC input. The common-mode signal that is present across the inputs of the instrumentation amplifier is derived from the transconduct- +VS ance amplifier, GM1. It is then connected to the inverting input R1 REFIN of A2 through a 150 kΩ resistor. 18 A3 ARLnD in FtBeg arnatdo Rr LcaDn t berem biunialtls b. yA c goononde csttianrgt ian cga ppoacinitto irs b ae t1w neFen the R2 C1 10866-046 Figure 47. Setting the Internal Reference capacitor, which places the crossover frequency at about 1 kHz To limit the power consumption of the voltage divider, the use (the frequency at which the amplifier has an inverting unity of large resistors is recommended, such as 10 MΩ. The designer gain). This configuration results in about 26 dB of loop gain must keep in mind that high resistor values make it easier for available at a frequency range from 50 Hz to 60 Hz for interfering signals to appear at the input of the reference buffer. common-mode line rejection. Higher capacitor values reduce To minimize noise pickup, it is recommended to place the resistors the crossover frequency, thereby reducing the gain that is close to each other and as near as possible to the REFIN terminal. available for rejection and, consequently, increasing the line Furthermore, use a capacitor in parallel with the lower resistor noise. Lower capacitor values move the crossover frequency to on the divider for additional filtering, as shown in Figure 47. higher frequencies, allowing increased gain. The tradeoff is that Keep in mind that a large capacitor results in better noise with higher gain, the system can become unstable and saturate filtering but it takes longer to settle the reference after power-up. the output of the right leg amplifier. The total time it takes the reference to settle within 1% can be Note that when using this amplifier to drive an electrode, there estimated with the formula should be a resistor in series with the output to limit the current R1R2C1 to be always less than 10 μA even in fault conditions. For t 5 example, if the supply used is 3.0 V, this resistor should be SETTLE_REFERENCE R1R2 greater than 330 kΩ to account for component and supply Note that disabling the AD8232 with the shutdown terminal variations. does not discharge this capacitor. FAST RESTORE CIRCUIT RLDFB 4 Because of the low cutoff frequency used in high-pass filters in ECG applications, signals may require several seconds to settle. 1nF This settling time can result in a frustrating delay for the user RLD VCM after a step response: for example, when the electrodes are first 158 A2 150kΩ TO DRIVEN R* connected. E*LLIEMCITT RCOUDRERENTTO LESS THAN 10µRAE.FOUT 10866-146 This fast restore function is implemented internally, as shown in Figure 46. Typical Configuration of Right-Leg Drive Circuit Figure 48. The output of the instrumentation amplifier is connec- ted to a window comparator. The window comparator detects a In two-electrode configurations, RLD can be used to bias the saturation condition at the output of the instrumentation amplifier inputs through 10 MΩ resistors as described in the Leads Off when its voltage approaches 50 mV from either supply rail. Detection section. If left unused, it is recommended to configure A2 as a follower by connecting RLDFB directly to RLD. FR 15 S1 REFERENCE BUFFER +IN +VS – 0.05V SWITCH 2 TIMING Tdreehfseeir gAennD co8ef 2sb3iun2fg foleepr- etsroua pcteprsely af traeop map vl iaicr astituniaoglnl ges r,s otuhupenp dAly Db. Te8to2w 3sei2em ninp tclhilfuey d steuhspe ap ly –IN3 IA IAOUT0.05V LLOODD+– S2 10866-047 Figure 48. Fast Restore Circuit voltage and the system ground. The signals present at the out- put of the instrumentation amplifier are referenced around this voltage. For example, if there is zero differential input voltage, Rev. C | Page 17 of 28
AD8232 Data Sheet SATURATION DETECTED NO SATURATION tS1 S1 tS2 S2 LEADS OFF LEADS ON tRST 10866-048 Figure 49. Timing Diagram for Fast Restore Switches (Time Base Not to Scale) If this saturation condition is present when both input electrodes DC Leads Off Detection are attached to the subject, the comparator triggers a timing The dc leads off detection mode is used in three-electrode con- circuit that automatically closes Switch S1 and Switch S2 (see figurations only. It works by sensing when either instrumentation Figure 49 for a timing diagram). amplifier input voltage is within 0.5 V from the positive rail. In These two switches (S1 and S2) enable two different 10 kΩ this case, each input must have a pull-up resistor connected to the resistor paths: one between HPSENSE and IAOUT and another positive supply. During normal operation, the subject’s potential between SW and REFOUT. During the time Switch S1 and must be inside the common-mode range of the instrumentation Switch S2 are enabled, these internal resistors appear in parallel amplifier, which is only possible if a third electrode is connected with their corresponding external resistors forming high-pass to the output of the right leg drive amplifier. filters. The result is that the equivalent lower resistance shifts +VS the pole to a higher frequency, delivering a quicker settling time. Note that the fast restore settling time depends on how 10MΩ 10MΩ quickly the internal 10 kΩ resistors of the AD8232 can drain the 2 capacitors in the high-pass circuit. Smaller capacitor values IA 3 result in a shorter settling time. If, by the end of the timing, the saturation condition persists, TO DRIVEN tohpee rcaytciloen r.e Ipf eeaitths.e Or othf etrhwe ilseea,d tsh eo fAf cDo8m23p2a rraettourr onus ttpou ittss ins oinrmdia-l ELECTRODE5 RLD 10866-049 cating that an electrode has been disconnected, the timing Figure 50. Circuit Configuration for DC Leads Off Detection circuit is prevented from triggering because it is assumed that Because in dc leads off mode the AD8232 checks each input no valid signal is present. To disable fast restore, drive the FR individually, it is possible to indicate which electrode is discon- pin low or tie it permanently to GND. nected. The AD8232 indicates which electrode is disconnected by LEADS OFF DETECTION setting the corresponding LOD− or LOD+ pin high. To use this mode, connect the AC/DC pin to ground. The AD8232 includes leads off detection. It features ac and dc detection modes optimized for either two- or three-electrode configurations, respectively. Rev. C | Page 18 of 28
Data Sheet AD8232 AC Leads Off Detection where power consumption is critical. A logic level signal can be applied to this pin to switch to shutdown mode, even when the The ac leads off detection mode is useful when using two supply is still on. electrodes only (it does not require the use of a driven electrode). In this case, a conduction path must exist between the two Driving the SDN pin low places the AD8232 in shutdown mode electrodes, which is usually formed by two resistors, as shown and draws less than 200 nA of supply current, offering in Figure 51. considerable power savings. To enter normal operation, These resistors also provide a path for bias return on each input. drive SDN high; when not using this feature, permanently Connect each resistor to REFOUT or RLD to maintain the inputs tie SDN to +VS. within the common-mode range of the instrumentation During shutdown operation, the AD8232 is not able to amplifier. maintain the REFOUT voltage, but it does not drain the REFIN +VS voltage, thereby maintaining this additional conduction path 17 from the supply to ground. When emerging from a shutdown condition, the charge stored 2 in the capacitors on the high-pass filters can saturate the instru- IA 3 mentation amplifier and subsequent stages. The use of the fast 10MΩ 10MΩ restore feature helps reduce the recovery time and, therefore, minimize on time in power sensitive applications. 8 REFOUT 10866-050 INPUT PROTECTION Figure 51. Circuit Configuration for AC Leads Off Detection All terminals of the AD8232 are protected against ESD. In addition, the input structure allows for dc overload conditions The AD8232 detects when an electrode is disconnected by that are a diode drop above the positive supply and a diode drop forcing a small 100 kHz current into the input terminals. This below the negative supply. Voltages beyond a diode drop of the current flows through the external resistors from IN+ to IN− supplies cause the ESD diodes to conduct and enable current to and develops a differential voltage across the inputs, which is flow through the diode. Therefore, use an external resistor in then synchronously detected and compared to an internal series with each of the inputs to limit current for voltages threshold. The recommended value for these external resistors beyond the supplies. In either scenario, the AD8232 safely is 10 MΩ. Low resistance values make the differential drop too handles a continuous 5 mA current at room temperature. low to be detected and lower the input impedance of the amplifier. When the electrodes are attached to the subject, the For applications where the AD8232 encounters extreme over- impedance of this path should be less than 3 MΩ to maintain load voltages, such as in cardiac defibrillators, use external series the drop below the comparator’s threshold. resistors and gas discharge tubes (GDT). Neon lamps are com- monly used as an inexpensive alternative to GDTs. These devices As opposed to the dc leads off detection mode, the AD8232 is can handle the application of large voltages but do not maintain able to determine only that an electrode has lost its connection, the voltage below the absolute maximum ratings for the AD8232. not which one. During such an event, the LOD+ pin goes high. A complete solution includes further clamping to either supply In this mode, the LOD− pin is not used and remains in a logic using additional resistors and low leakage diode clamps, such as low state. To use the ac leads off mode, tie the AC/DC pin to the BAV199 or FJH1100. positive supply rail. As a safety measure, place a resistor between the input pin and Note that while REFOUT is at a constant voltage value, using the electrode that is connected to the subject to ensure that the the RLD output as the input bias may be more effective in current flow never exceeds 10 µA. Calculate the value of this rejecting common-mode interference. resistor to be equal to the supply voltage across the AD8232 STANDBY OPERATION divided by 10 µA. The AD8232 includes a shutdown pin (SDN) that further enhances the flexibility and ease of use in portable applications Rev. C | Page 19 of 28
AD8232 Data Sheet RADIO FREQUENCY INTERFERENCE (RFI) INPUT REFERRED OFFSETS Radio frequency (RF) rectification is often a problem in Because of its internal architecture, the instrumentation amplifier applications where there are large RF signals. The problem should be used always with the dc blocking amplifier, shown as appears as a dc offset voltage at the output. The AD8232 has a HPA in Figure 45. 15 pF gate capacitance and 10 kΩ resistors at each input. This As described in the Theory of Operation section, the dc blocking forms a low-pass filter on each input that reduces rectification amplifier attenuates the input referred offsets present at the at high frequency (see Figure 52) without the addition of inputs of the instrumentation amplifier. However, this is true external elements. only when the dc blocking amplifier is used as an integrator. In this configuration, the input offsets from the dc blocking 10kΩ +IN amplifier dominate appear directly at the output of the CG instrumentation amplifier. –IN 10kΩ AD8232 IAOUT CG If the dc blocking amplifier is used as a follower instead of its 10866-151 itnhtee innd-eadm fpu narcet iaomn palsi fained i nbtye gar faatcotro, rt hoef i1n0p0u. t referred offsets of Figure 52. RFI Filter Without External Capacitors LAYOUT RECOMMENDATIONS For increased filtering, additional resistors can be added in It is important to follow good layout practices to optimize series with each input. They must be placed as close as possible system performance. In low power applications, most resistors to the instrumentation amplifier inputs. These can be the same are of a high value to minimize additional supply current. The resistors used for overload and patient protection. challenge of using high value resistors is that high impedance POWER SUPPLY REGULATION AND BYPASSING nodes become even more susceptible to noise pickup and board parasitics, such as capacitance and surface leakages. Keep all of The AD8232 is designed to be powered directly from a single the connections between high impedance nodes as short as 3 V battery, such as CR2032 type. It can also operate from possible to avoid introducing additional noise and errors from rechargeable lithium-ion batteries, but the designer must take corrupting the signal. into account that the voltage during a charge cycle may exceed the absolute maximum ratings of the AD8232. To avoid damage To maintain high CMRR over frequency, keep the input traces to the part, use a power switch or a low power, low dropout symmetrical and length matched. Place safety and input bias regulator, such as ADP150. resistors in the same position relative to each input. In addition, the use of a ground plane significantly improves the noise In addition, excessive noise on the supply pins can adversely rejection of the system. affect performance. As in all linear circuits, bypass capacitors must be used to decouple the chip power supplies. Place a 0.1 μF capacitor close to the supply pin. A 1 μF capacitor can be used farther away from the part. In most cases, the capacitor can be shared by other integrated circuits. Keep in mind that excessive decoupling capacitance increases power dissipation during power cycling. Rev. C | Page 20 of 28
Data Sheet AD8232 APPLICATIONS INFORMATION ELIMINATING ELECTRODE OFFSETS Just like with any high-pass filter with low frequency cutoff, any fast change in dc offset takes a long time to settle. If such change The instrumentation amplifier in the AD8232 is designed to saturates the instrumentation amplifier output, the S1 switch apply gain and to filter out near dc signals simultaneously. This briefly enables the 10 kΩ resistor path, thus moving the cutoff capability allows it to amplify a small ECG signal by a factor of frequency to 100 yet reject electrode offsets as large as ±300 mV. To achieve offset rejection, connect an RC network between the f =100(R+104) (1) output of the instrumentation amplifier, HPSENSE, and −3dB 2πRC(104) HPDRIVE, as shown in Figure 53. For values of R greater than 100 kΩ, the expression in Equation 1 C R can be approximated by 1 1 20 19 f = HPDRIVE HPSENSE IAOUT −3dB 200πC IN+ 2 HPA 10kΩ This higher cutoff reduces the settling time and enables faster 3 GM1 GM2 R S1 recovery of the ECG signal. For more information, see the Fast IN– VCM 99R Restore Circuit section. EOLFEFCSTERTOSDE C1 = REFOUT 10866-253 HThIGe AHD-P82A3S2 Sc aFnI LimTpElRemINenGt higher order high-pass filters. A Figure 53. Eliminating Electrode Offsets higher filter order yields better artifact rejection but at a cost of This RC network forms an integrator that feeds any near dc signals increased signal distortion and more passive components on the back into the instrumentation amplifier, thus eliminating the offsets printed circuit board (PCB). without saturating any node and maintaining high signal gain. Two-Pole High-Pass Filter In addition to blocking offsets present across the inputs of the A two-pole architecture can be implemented by adding a simple instrumentation amplifier, this integrator also works as a high- ac coupling RC at the output of the instrumentation amplifier, pass filter that minimizes the effect of slow moving signals, such as shown in Figure 55. as baseline wander. The cutoff frequency of the filter is given by the equation C1 R1 C2 TSOTA NGEEXT f = 100 1 20 19 6 −3dB 2πRC HPDRIVE HPSENSE IAOUT SW R2 10kΩ where R is in ohms and C is in farads. HPA 10kΩ +IN S1 S2 Note that the filter cutoff is 100 times higher than is typically 2 expected from a single-pole filter. Because of the feedback 3 REFOUT 8 –IN architecture of the instrumentation amplifier, the typical filter cutoff equation is modified by the gain of 100 of the = REFOUT 10866-053 instrumentation amplifier. Figure 55. Schematic for a Two-Pole High-Pass Filter 50 Note that the right side of C2 connects to the SW terminal. Just like S1, S2 reduces the recovery time for this ac coupling network 40 by placing 10 kΩ in parallel with R2. See the Fast Restore Circuit section for additional details on switch timing and B) E (d 30 trigger conditions. D TU 20dB PER Keep in mind that if this passive network is not buffered, it NI DECADE G 20 exhibits higher output impedance at the input of a subsequent A M low-pass filter, such as with Sallen-Key filter topologies. Careful component selection can yield good results without a buffer. See 10 the Low-Pass Filtering and Gain section for additional information on component selection. 00.01 0.1 FREQUE1NCY (Hz) 10 100 10866-153 Figure 54. Frequency Response of Single-Pole DC Blocking Circuit Rev. C | Page 21 of 28
AD8232 Data Sheet Additional High-Pass Filtering Options When additional low frequency rejection is desired, a high-order high-pass filter can be implemented by adding an ac coupling In addition to the topologies explained in the previous sections, network at the output of the instrumentation amplifier, as shown in an additional pole may be added to the dc blocking circuit for Figure 57. The SW terminal is connected to the ac coupling network additional rejection of low frequency signals. This configuration to obtain the best settling time response when fast restore engages. is shown in Figure 56. TO NEXT C1 R1 R2 TSOTA NGEEXT C1 R1 R2 C3 STAGE RCOMP RCOMP 1 20 19 6 1 20 19 6 HPDRIVE HPSENSE IAOUT SW HPDRIVE HPSENSE IAOUT SW 10kΩ C2 R3 10kΩ C2 +IN HPA S1 10kΩ S2 +IN HPA S1 10kΩ S2 2 2 3 REFOUT 8 3 REFOUT 8 –IN –IN = REFOUT 10866-155 = REFOUT 10866-156 Figure 57. Schematic for a Three-Pole High-Pass Filter Figure 56. Schematic for an Alternative Two-Pole High-Pass Filter 60 An extra benefit of this circuit topology is that it allows lower cutoff frequency with lower R and C values and the resistor, 40 40dB PER R , can be used to control the Q of the filter to achieve narrow DECADE COMP band-pass filters (for heart rate detection) or maximum pass- 20dB PER 60dB PER B) 20 DECADE DECADE band flatness (for cardiac monitoring). d E ( D With this topology, the filter attenuation reverts to a single pole U 0 T roll off at very low frequencies. Because the initial roll off was 40 dB GNI A per decade, this reversion to 20 dB per decade has little impact on M –20 the ability of the filter to reject out-of-band low frequency signals. The designer may choose different values to achieve the desired –40 40dB PER DECADE THREE-POLE FILTER filter performance. To simplify the design process, use the following TWO-POLE FILTER recomRm1 e=n Rda2t i≥on 1s0 a0s ka Ωst arting point for component value selection. –600.01 0.1 FREQUE1NCY (Hz) 10 100 10866-157 Figure 58. Frequency Response of Circuits in Figure 56 and Figure 57 C1 = C2 Careful analysis and adjustment of all of the component values R = 0.14 × R1 COMP in practice is recommended to optimize the filter characteristics. The cutoff frequency is located at A useful hint is to reduce the value of RCOMP to increase the peaking of the active filter to overcome the additional roll off introduced f = 10 C 2π R1C1R2C2 by the ac coupling network. Proper adjustment can yield the best pass-band flatness. The selection of R to be 0.14 times the value of the other two COMP The design of the high-pass filter involves tradeoffs between signal resistors optimizes the filter for a maximally flat pass band. Reduce distortion, component count, low frequency rejection, and its value to increase the Q and, consequently, the peaking of the component sizes. For example, a single-pole high-pass filter filter. Keep in mind that a very low value of R can result in COMP results in the least distortion to the signal, but its rejection of an unstable circuit. The selection of values based on these criteria low-frequency artifacts is the lowest Table 4 compares the result in a transfer function similar to the one shown in Figure 58. recommended filtering options. Table 4. Comparison of High-Pass Filtering Options Filter Order Component Count Low Frequency Rejection Capacitor Sizes/Values Signal Distortion1 Output Impedance2 Figure 53 1 2 Good Large Low Low Figure 55 2 4 Better Large Medium Higher Figure 56 2 5 Better Smaller Medium Low Figure 57 3 7 Best Smaller Highest Higher 1 For equivalent corner frequency location. 2 Output impedance refers to the drive capability of the high-pass filter before the low-pass filter. Low output impedance is desirable to allow flexibility in the selection of values for a low-pass filter, as explained in the Low-Pass Filtering and Gain section. Rev. C | Page 22 of 28
Data Sheet AD8232 LOW-PASS FILTERING AND GAIN the instrumentation amplifier output and the input of the low- pass filter without a buffer. The AD8232 includes an uncommitted op amp that can be used for extra gain and filtering. For applications that do not require To connect these two filtering stages properly without a buffer, a high-order filter, a simple RC low-pass filter should suffice, make the value of R1 at least ten times larger than the resistor of and the op amp can buffer or further amplify the signal. the ac coupling network (labeled as R2 in Figure 55). DRIVING ANALOG-TO-DIGITAL CONVERTERS FROM IN-AMP STAGE R FILTERED SIGNAL The ability of AD8232 to drive capacitive loads makes it ideal to A1 drive an ADC without the need for an additional buffer. However, C depending on the input architecture of the ADC, a simple low- REFOUT 10866-158 pfraosms R thCe n sewtwitcohrked m-caayp bacei rtoeqr uinirpeudt ttoy pdieccaol uopf lme tohdee rtrna nAsDieCntss. Figure 59. Schematic for a Single-Pole Low-Pass Filter and Additional Gain This RC network also acts as an additional filter that can help reduce noise and aliasing. Follow the recommended guidelines Applications that require a steeper roll off or a sharper cut off, a from the ADC data sheet for the selection of proper R and C values. Sallen-Key filter topology can be implemented, as shown in Figure 60. AD8232 C1 FROM IN-AMP R STAGE R1 R2 FILTERED A1 10 ADC A1 R3SIGNAL Figure 61. DrivCing an ADC 10866-261 C2 REFOUT R4 10866-159 DA RdrIiVveEnN l eEaLd E(oCrT rRefOerDenEce electrode) is often used to minimize Figure 60. Schematic for a Two-Pole Low-Pass Filter the effects of common-mode voltages induced by the power line The following equations describe the low-pass cut off frequency, and other interfering sources. The AD8232 extracts the common- gain, and Q: mode voltage from the instrumentation amplifier inputs and f = 1/(2π√(R1 C1 R2 C2)) makes it available through the RLD amplifier to drive an opposing C signal into the patient. This functionality maintains the voltage Gain = 1 + R3/R4 between the patient and the AD8232 at a near constant, greatly R1C1R2C2 improving the common-mode rejection ratio. Q R1C2R2C2R1C11Gain As a safety measure, place a resistor between the RLD pin and Note that changing the gain has an effect on Q and vice versa. the electrode connected to the subject to ensure that current Common values for Q are 0.5 to avoid peaking or 0.7 for flow never exceeds 10 μA. Calculate the value of this resistor to maximum flatness and sharp cut off. A high value of Q can be be equal to the supply voltage across the AD8232 divided by 10 μA. used in narrow-band applications to increase peaking and the The AD8232 implements an integrator formed by an internal selectivity of the band-pass filter. 150 kΩ resistor and an external capacitor to drive this electrode. A common design procedure is to set R1 = R2 = R and C1 = C2 = Choice of the integrator capacitor is a tradeoff between line rejec- C, which simplifies the expressions for cutoff frequency and Q to tion capability and stability. The capacitor should be small to maintain as much loop gain as possible, around 50 Hz and 60 Hz, f = 1/(2πRC) C which are typical line frequencies. For stability, the gain of the 1 Q integrator should be less than unity at the frequency of any 3Gain other poles in the loop, such as those formed by the patient’s Note that Q can be controlled by setting the gain with R3 and capacitance and the safety resistors. The suggested application R4; however, this limits the gain to be less than 3. For gain circuits use a 1 nF capacitor, which results in a loop gain of about values equal to or greater than 3, the circuit becomes unstable. 20 at line frequencies, with a crossover frequency of about 1 kHz. A simple modification that allows higher gains is to make the In a two-lead configuration, the RLD amplifier can be used to value of C2 at least four times larger than C1. drive the bias current resistors on the inputs. Although not as It is important to note that these design equations only hold effective as a true driven electrode, this configuration can true in the case that the output impedance of the previous stage provide some common-mode rejection improvement if the is much lower than the input impedance of the Sallen-Key filter. sense electrode impedance is small and well matched. This is not the case when using an ac coupling network between Rev. C | Page 23 of 28
AD8232 Data Sheet APPLICATION CIRCUITS HEART RATE MEASUREMENT NEXT TO THE HEART The input terminals in this configuration use two 180 kΩ resistors, to protect the user from fault conditions. Two 10 MΩ For wearable exercise devices, the AD8232 is typically placed in resistors provide input bias. Use higher values for electrodes a pod near the heart. The two sense electrodes are placed under- with high output impedance, such as cloth electrodes. neath the pectoral muscles; no driven electrode is used. Because the distance from the heart to the AD8232 is small, the heart The schematic also shows two 10 MΩ resistors to set the signal is strong and there is less muscle artifact interference. midscale reference voltage. If there is already a reference voltage available, it can be driven into the REFIN input to eliminate In this configuration, space is at a premium. By using as few these two 10 MΩ resistors. external components as possible, the circuit in Figure 62 is optimized for size. EXERCISE APPLICATION: HEART RATE MEASURED AT THE HANDS 0.22µF In this application, the heart rate signal is measured at the hands with stainless steel electrodes. The user’s arm and upper ELECTRODE HPDRIVE HPSENSE INTERFACE 180kΩ 10MΩ body movement create large motion artifacts and the long lead +IN IAOUT 10MΩ 180kΩ +VS length makes the system susceptible to common-mode inter- –IN REFIN ference. A very narrow band-pass characteristic is required to 10MΩ 0.1µF 10MΩ RLDFB +VS 10MΩ separate the heart signal from the interferers. 1nF 0.1µF RLD GND AD8232 +VS 0.22µF SW FR OPAMP+ AC/DC +VS 10MΩ HPDRIVE HPSENSE REFOUT SDN 10MΩ 180kΩ 10MΩ LA +IN IAOUT OPAMP– LO+ TO DIGITAL 180kΩ +VS INTERFACE RA –IN REFIN OUT LO– SOIUGTNPAULT 10866-161 RL 360k0Ω.22µF 1nF RRLLDDFBAD8232 G+NVDS 01.10µMFΩ 10MΩ 0.1µF Figure 62. Circuit for Heart Rate Measurement Next to Heart SW FR +VS 1MΩ 1MΩ A shorter distance from the AD8232 to the heart makes this OPAMP+ AC/DC 100kΩ 22nF application less vulnerable to common-mode interference. REFOUT SDN 100kΩ Husoewd etvoe irm, spinrocvee R tLhDe cios mnomt ounse-md tood de rrievjee catnio enle bcytr modaein, itta cinainn bg e 3.3nF 1MΩ OPAMP– LO+ ITNOT EDRIGFIATCAEL OUT LO– tAh es imngildes-cpaolele v hoilgtahg-ep athssr ofiultgehr itsh ese 1t 0a tM 7Ω H bz,i aasn rde stihsetorer si.s no low- SIGNAL OUTPUT 10866-262 Figure 64. Circuit for Heart Rate Measurement at Hands pass filter. No gain is used on the output op amp thereby reducing the number of resistors for a total system gain of 100. The circuit in Figure 64 uses a two-pole high-pass filter set at 7 Hz. A two-pole low-pass filter at 24 Hz follows the high-pass 70 filters to eliminate any other artifacts and line noise. 60 70 50 60 B) d E ( 40 50 D TU B) GNI 30 E (d 40 A D M U T 20 NI 30 G A M 10 20 00.1 1 FR10EQUENCY 1(H00z) 1k 10k 10866-057 10 Figure 63. Frequency Response for HRM Next to Heart Circuit 00.1 1 FREQUE1N0CY (Hz) 100 1k 10866-059 Figure 65. Frequency Response for HRM Circuit Taken at the Hands Rev. C | Page 24 of 28
Data Sheet AD8232 The overall narrow-band nature of this filter combination In addition to 40 Hz filtering, the op amp stage is configured for distorts the ECG waveform significantly. Therefore, it is only a gain of 11, resulting in a total system gain of 1100. To suitable to determine the heart rate, and not to analyze the ECG optimize the dynamic range of the system, the gain level is signal characteristics. adjustable, depending on the input signal amplitude (which may vary with electrode placement) and ADC input range. The low-pass filter stage also includes a gain of 11, to bring the total system gain close to 1100 (note that the filter roll off PORTABLE CARDIAC MONITOR WITH ELIMINA- prevents the maximum gain from reaching this value). Because TION OF MOTION ARTIFACTS the ECG signal is measured at the hands, it is weaker than when The circuit in Figure 68 shows an implementation of a battery- measured closer to the heart. powered embedded system for monitoring heart rate in The RLD circuit drives to the third electrode, which can also be applications where the patient engages in moderate activity, located at the hands, to cancel common-mode interference. such as with a Holter monitor. The AD8232 uses a three- CARDIAC MONITOR CONFIGURATION electrode patient interface and implements a two-pole high- pass filter with a cutoff at 0.3 Hz, and a two-pole low-pass filter This configuration is designed for monitoring the shape of the with a cutoff frequency of 37 Hz. The total signal gain in the ECG waveform. It assumes that the patient remains relatively pass band is 400. The fully conditioned signal is sampled by the still during the measurement, and therefore, motion artifacts sigma-delta ADC integrated on the low power microcontroller, are less of an issue. ADuCM360. The wide dynamic range of this ADC provides flexibility to reduce the signal gain to avoid saturation, depending 0.33µF on electrode placement. +VS 0.33µF REFOUT Because the pass band is relatively wide for ambulatory applica- 10MΩ 10MΩ 1.4MΩ tions, the ADXL346 accelerometer signal can be used to further HPDRIVE HPSENSE 10MΩ 180kΩ 10MΩ minimize the noise introduced by the motion of the patient. LA +IN IAOUT 180kΩ +VS Moreover, the microcontroller can use the motion information RA –IN REFIN 10MΩ 0.1µF to monitor inactivity and to issue a system shutdown to save RLDFB +VS 10MΩ battery power. 360kΩ 1nF 0.1µF RL RLD GND AD8232 The low dropout regulator ensures that the maximum of 3 V is SW FR +VS not exceeded, especially during charge cycles of the battery, 1MΩ 1MΩ OPAMP+ AC/DC which can be a lithium-ion cell. 10nF REFOUT SDN 100kΩ In this application, the ADuCM360 uses its Port 0 to perform 1.5nF 1MΩ OPAMP– LO+ ITNOT EDRIGFIATCAEL DMA transfers to the host communication interface or to an OUT LO– SIGNAL OUTPUT 10866-266 oHno-wbeovaerrd, mine amnyo rpya, ritfi creuclaorr daipnpgl itchaeti wona,v tehfoisr mpo frot rs hlaotuerld t rbaen sufseerd. Figure 66. Circuit for ECG Waveform Monitoring for the busiest interface to minimize CPU cycles and maintain low power operation. To obtain an ECG waveform with minimal distortion, the AD8232 is configured with a 0.5 Hz two-pole high-pass filter Note that this circuit is shown to demonstrate the capabilities of followed by a two-pole, 40 Hz, low-pass filter. A third electrode AD8232 and other system components. It is not a complete is driven for optimum common-mode rejection. system design and additional effort must be made to ensure compliance with medical safety guidelines from regulatory 70 agencies. 60 50 B) d E ( 40 D U T NI 30 G A M 20 10 00.01 0.1 FR1EQUENCY (1H0z) 100 1k 10866-061 Figure 67. Frequency Response of Cardiac Monitor Circuit Rev. C | Page 25 of 28
AD8232 Data Sheet +VS 4.7µF 10MΩ 10MΩ 180kΩ HPDRIVE HPSENSE 10MΩ +VS = +2.8V VAODUPT150x-2V.I8N LA 180kΩ +IN IAOUT +VS 1µF GND 1µF VBATT RA –IN REFIN ELECTRODE 10MΩ 0.1µF INTERFACE 4.7µF RLDFB +VS 10MΩ 360kΩ 1nF 0.1µF RL RLD GND AD8232 SW FR +VS 1MΩ 1MΩ OPAMP+ AC/DC ADuCM360 ADXL346 100kΩ 6.8nF P0.6/IRQ2 INT2 REFOUT SDN P1.2 VS +VS 332kΩ P1.7/CS0 CS 2.7nF OPAMP– LO+ P1.1 P1.6/MOSI0 SDO/ALT_ADD VDDIO 1MΩ 1µF OUT LO– P1.0 P1.4/MISO0 SDA/SDI/SDIO GND P1.SCLK0 SCL/SCLK AIN0 REG_DVDD AIN1 0.47µF 0.47µF AVDD_REG +VS VREF+ 4.7µF AVDD P0.3/CS1 CS IOVDD P0.0/MISO1 TX TMOE MHOOSRTY, VREF– P0.2/MOSI1 RX OR GND P0.1/SCLK1 CLK DISPLAY 10866-163 Figure 68. Low Power Portable Cardiac Monitor Rev. C | Page 26 of 28
Data Sheet AD8232 PACKAGING AND ORDERING INFORMATION OUTLINE DIMENSIONS DETAIL A (JEDEC 95) 4.10 0.30 4.00 SQ 0.25 PIN 1 3.90 0.18 INDICATOR PIN 1 0.50 16 20 I(NSDEEIC DAETTAOIRL AAR)EA OPTIONS BSC 15 1 2.75 EXPPAODSED 2.60 SQ 2.35 11 5 0.50 10 6 0.20 MIN TOP VIEW BOTTOM VIEW 0.40 0.30 0.80 FOR PROPER CONNECTION OF 0.75 SIDE VIEW THE EXPOSED PAD, REFER TO 0.05 MAX THE PIN CONFIGURATION AND 0.70 0.02 NOM FUNCTION DESCRIPTIONS SECTION OF THIS DATA SHEET. COPLANARITY SEATING 0.08 PKG-003502 PLANE COMPLIANTTOJEDE0C.2 S0T RAENFDARDS MO-220-WGGD-11. 10-12-2017-C Figure 69. 20-Lead Lead Frame Chip Scale Package [LFCSP] 4 mm × 4 mm Body and 0.75 mm Package Height (CP-20-8) Dimensions shown in millimeters ORDERING GUIDE Model1 Temperature Range Package Description Package Option AD8232ACPZ-R7 −40°C to +85°C 20-Lead Lead Frame Chip Scale Package [LFCSP] CP-20-8 AD8232ACPZ-RL −40°C to +85°C 20-Lead Lead Frame Chip Scale Package [LFCSP] CP-20-8 AD8232ACPZ-WP −40°C to +85°C 20-Lead Lead Frame Chip Scale Package [LFCSP] CP-20-8 AD8232-EVALZ Evaluation Board 1 Z = RoHS Compliant Part. Rev. C | Page 27 of 28
AD8232 Data Sheet NOTES ©2012–2018 Analog Devices, Inc. All rights reserved. Trademarks and registered trademarks are the property of their respective owners. www.analog.com/AD8232 D10866-0-6/18(C) Rev. C | Page 28 of 28
Mouser Electronics Authorized Distributor Click to View Pricing, Inventory, Delivery & Lifecycle Information: A nalog Devices Inc.: AD8232ACPZ-WP AD8232ACPZ-R7 AD8232ACPZ-RL AD8232-EVALZ
 Datasheet下载
